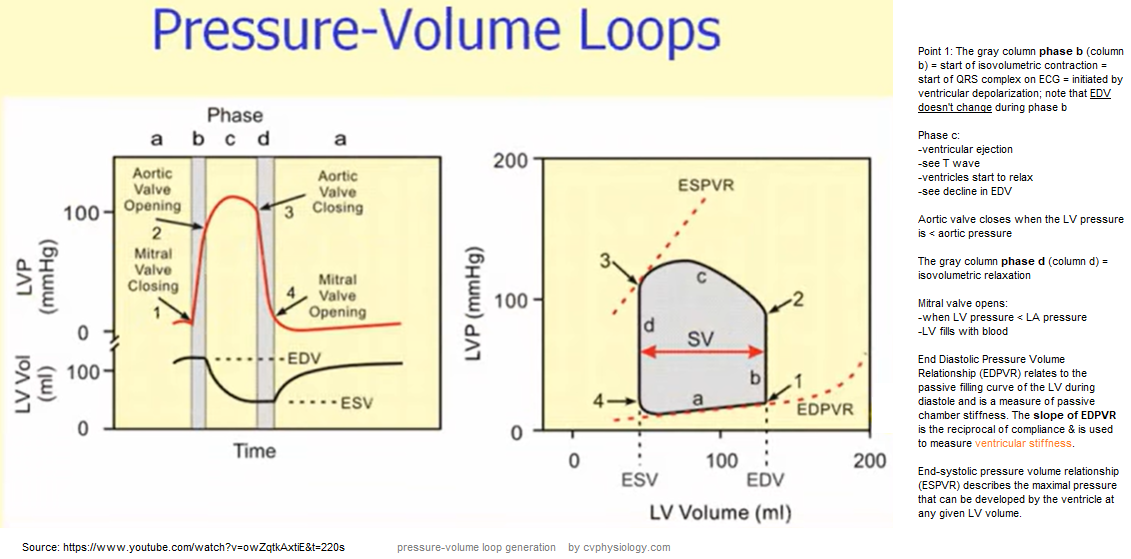

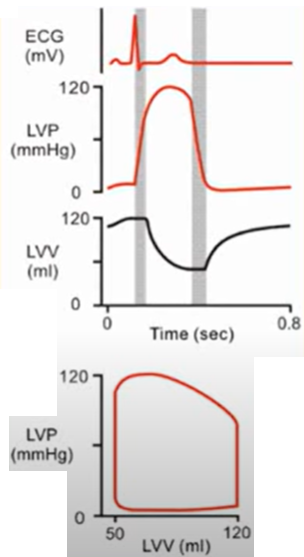
Klabunde video here
Facts:
takes 0.8 sec to complete.
Click here for animation of cardiac cycle
Diastole:
Systole:
The driving pressure of the systemic circulation is MAP minus the mean systemic pressure. The mean systemic pressure is the theoretical pressure value that would be observed in the overall circulatory system under zero flow conditions. As derived from Ohm’s law, the driving pressure (or, blood pressure--mine) is the product of cardiac output (CO) & systemic vascular resistance (SVR), ie, Voltage = Flow x Resistance or V = I x R (mine)
Given that mean systemic pressure cannot routinely be measured, mean right atrial pressure (mRAP) is currently taken as a surrogate, such that MAP can be expressed as follows:
MAP = (heart rate × SV × SVR) + mRAP
Where SV is the stroke volume. Three important points must be stressed. First, SVR is not a measured parameter but is calculated from the measured values of MAP, CO & mRAP. Second, despite clear limitations in Poiseuille’s Law when it is applied to the human circulation, it is generally believed that SVR is inversely proportional to the fourth power of the functional radius of the systemic network (mainly that of the distal resistive arteries). Finally, for a given MAP, SVR depends only on the value of CO, regardless of the way in which CO is generated (e.g. low SV/high heart rate or high SV/low heart rate).
Mean systemic filling pressure (MSFP) is the pressure in only the systemic circuit, i.e. ignoring the heart & pulmonary circulation, also in the absence of flow.
Mean circulatory filling pressure (MCFP) is the pressure that would be measured at all points in the entire circulatory system if the heart were stopped suddenly & the blood were redistributed instantaneously in such a manner that all pressures were equal.
MCFP & MSFP are usually about 7-8 mmHg.
The main determinants of MCFP & MSFP are total blood volume & venous resistance
Pulse Pressure (PP)
↑ PP = ↑ SV
In older pts increased arterial stiffness leads to increased PP, & this results in systolic HTN associated with decreased diastolic arterial pressure. On the other hand, in pts with cardiogenic or hypovolemic shock, decreased SV results in a lower PP. The paradoxical finding of a low PP in the elderly & in pts with hypertension or atherosclerosis strongly suggests that SV is markedly low (unpublished observation) because arterial stiffness is expected to be increased in these pts. It is likely that the monitoring of short-term PP changes in critically ill pts may provide valuable, indirect information on concomitant SV changes. In this regard, increases in PP induced by passive leg raising are linearly related to concomitant SV changes in mechanically ventilated pts.
LVEDP is normally ~ 8 -12 mm Hg
LVEDP >15 mm Hg (1 mm Hg = 0.133 kpa) was defined as the increased left ventricular filling pressure.
Chamber Pressure tells you about the compliance of the ventricle. The chamber pressure should not rise much when the chamber is filling with blood volume; otherwise, if chamber pressure does rise, it means chamber compliance has decreased.
Clinical measurement of Preload
|
Table 1 – Pressures observed within cardiac chambers during systole and diastole |
|
|
Heart region |
Pressure (mmHg) |
|
Right atrium |
0-4 |
|
Right ventricle |
25 systolic; 4 diastolic |
|
Pulmonary artery |
25 systolic; 10 diastolic |
|
Left atrium |
8-10 |
|
Left ventricle |
120 systolic; 10 diastolic |
|
Aorta |
120 systolic; 80 diastolic |
The above table shows the range of pressures present throughout the heart during the cardiac cycle. Knowing these values can help us understand the progression between different stages of the cycle. For example, the pulmonary artery has a systolic pressure of 25mmHg, so the right ventricle must match this force to successfully eject blood.
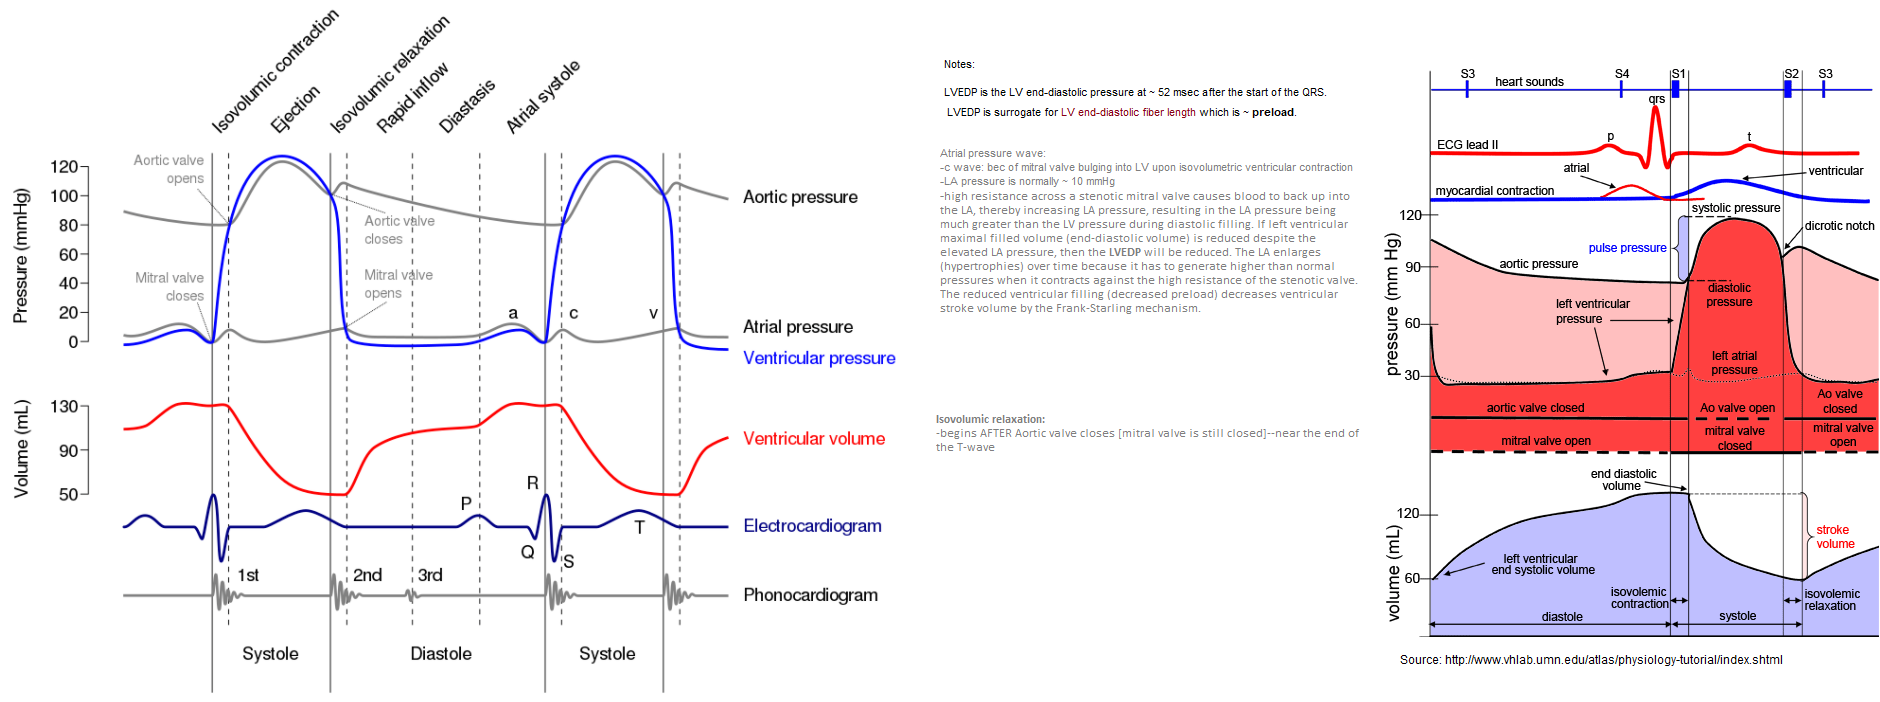
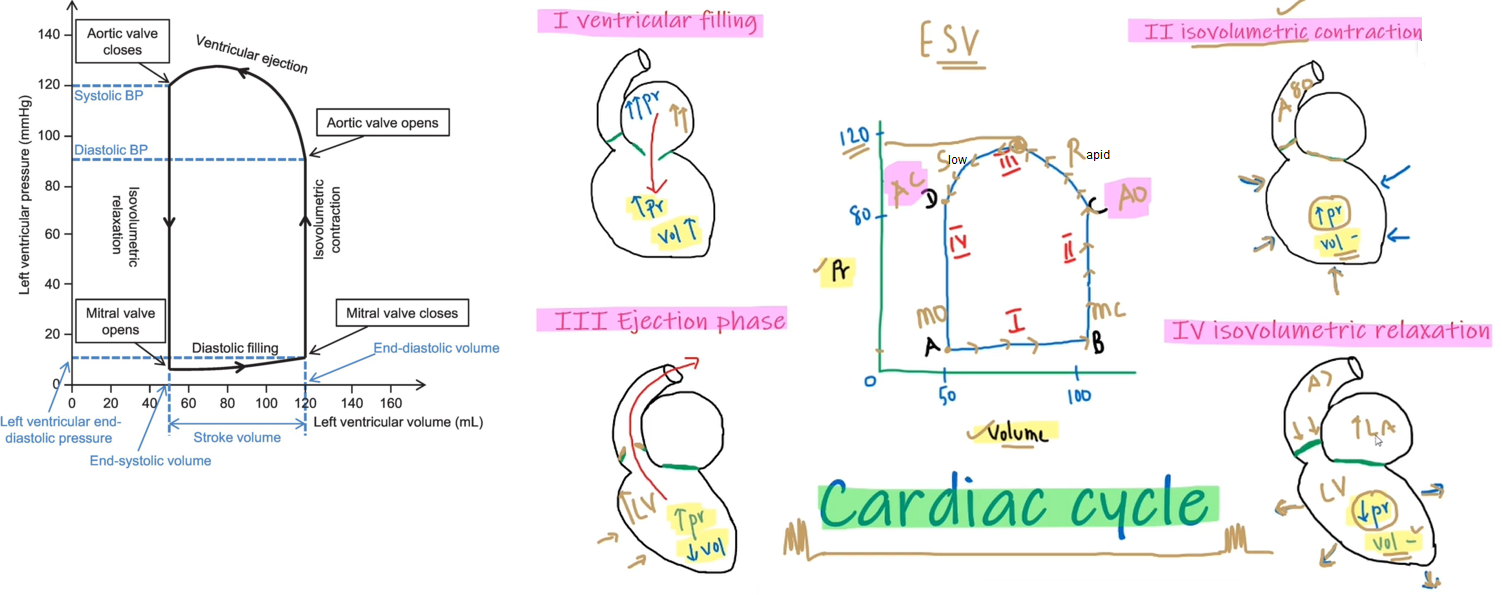
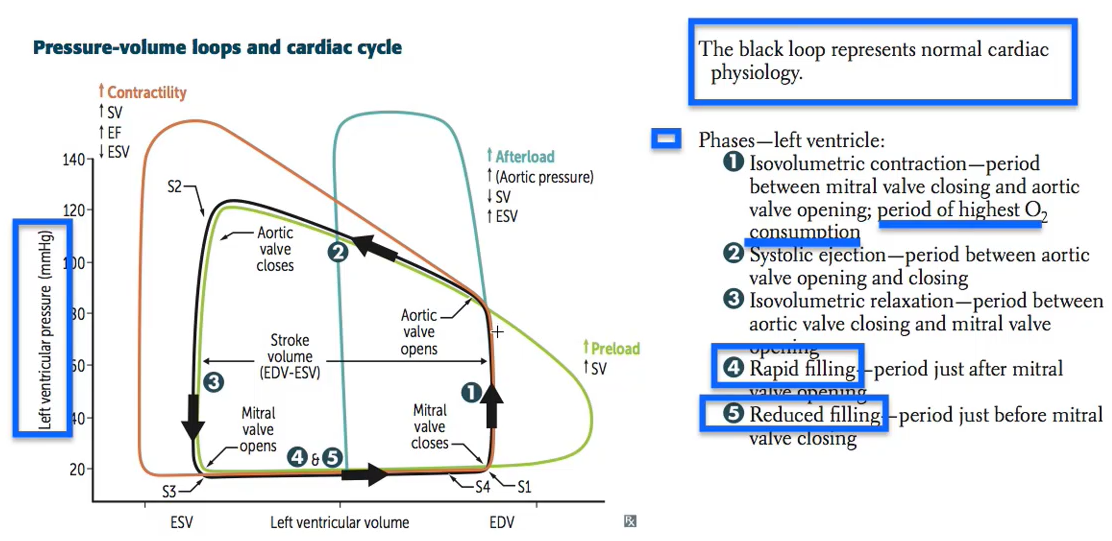
The QRS complex on the surface ECG represents ventricular depolarization. Contraction (systole) begins after an approximately 50 ms delay & results in closure of the mitral valve. The left ventricle contracts isovolumetrically until the ventricular pressure exceeds the systemic pressure, which opens the aortic valve and results in ventricular ejection. Bulging of the mitral valve into the left atrium during isovolumetric contraction causes a slight increase in left atrial pressure (c wave). Shortly after ejection begins, the active state of ventricular myocardium declines, and ventricular pressure begins to decrease. Left atrial pressure rises during ventricular systole (v wave) as blood returns to the left atrium by means of the pulmonary veins. The aortic valve closes when left ventricular pressure falls below aortic pressure, & momentum briefly maintains forward flow despite greater aortic than left ventricular pressure. Ventricular pressure then declines exponentially during isovolumetric relaxation, when both the aortic & mitral valves are closed. This begins the ventricular diastole. When ventricular pressure declines below left atrial pressure, the mitral valve opens, & ventricular filling begins. Initially, ventricular filling is very rapid because of the relatively large pressure gradient between the atrium and ventricle. Ventricular pressure continues to decrease after mitral valve opening because of continued ventricular relaxation; its subsequent increase (& the decrease in atrial pressure) slows ventricular filling. Especially at low end-systolic volumes, early rapid ventricular filling can be facilitated by ventricular suction produced by elastic recoil. Ventricular filling slows during diastasis, when atrial and ventricular pressures & volumes increase vary gradually. Atrial depolarization is followed by atrial contraction, increased atrial pressure (a wave), & a second, late rapid-filling phase. A subsequent ventricular depolarization completes the cycle.
In cardiac physiology, isovolumetric contraction is an event occurring in early systole during which the ventricles contract with no corresponding volume change (isovolumetrically). This short-lasting portion of the cardiac cycle takes place while all heart valves are closed.
When does left atrial pressure exceed left ventricular pressure?
When does ventricular diastole begin?
Atrial pressure wave:
Left atrial pressure can be estimated by recording the pulmonary capillary wedge pressure.
-c wave: because of mitral valve bulging into LV upon isovolumetric ventricular contraction. May or may not see this.
-LA pressure is normally ~ 10 mmHg
-x-descent: due to LV getting smaller during contraction/ejection of SV into aorta; this causes more space for LA to expand its internal volume --> decreased LA pressure. This decrease in atrial pressure enhances venous return. See my video.
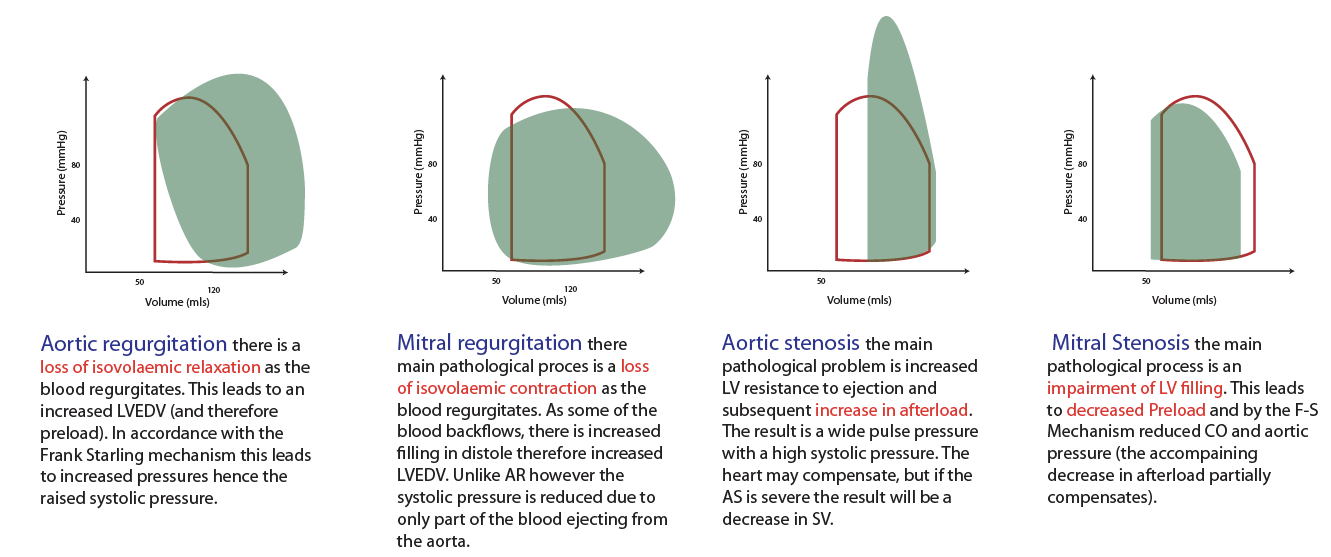
-high resistance across a stenotic mitral valve causes blood to back up into the LA, thereby increasing LA pressure, resulting in the LA pressure being much greater than the LV pressure during diastolic filling. If left ventricular maximal filled volume (end-diastolic volume) is reduced despite the elevated LA pressure, then the LVEDP will be reduced. The LA enlarges (hypertrophies) over time because it has to generate higher than normal pressures when it contracts against the high resistance of the stenotic valve. The reduced ventricular filling (decreased preload) decreases ventricular stroke volume by the Frank-Starling mechanism.
LV pressure & volume are related to the Doppler transmitral LV filling curve. LV diastole is often divided into 4 phases. After closure of the aortic valve, ventricular pressure declines, without a change in volume, until LA pressure exceeds LV pressure & opens the mitral valve (isovolumic relaxation, measured by the isovolumic relaxation time [IVRT]). The early rapid filling phase begins (measured by the peak early velocity, E), driven by the atrioventricular pressure gradient across the mitral valve. The deceleration time of early mitral filling is inversely related to ventricular stiffness (a function of the passive pressure–volume relationship), as continued ventricular filling increases LV pressure & equilibration with LA pressure (diastasis). The contribution to LV filling of the ensuing atrial contraction (measured by the late diastolic peak velocity, A) depends on ventricular diastolic pressure & stiffness, & atrial contractility.

Pressure-Volume Loop: Cardiac Cycle
Explanatory video for above is here
Video on Pressure-Volume Loop pathology by William Bridge --explains above figure
Video from Meet Patel is here; shortened version is here
Video from Bettina Booker is here; shortened version is here
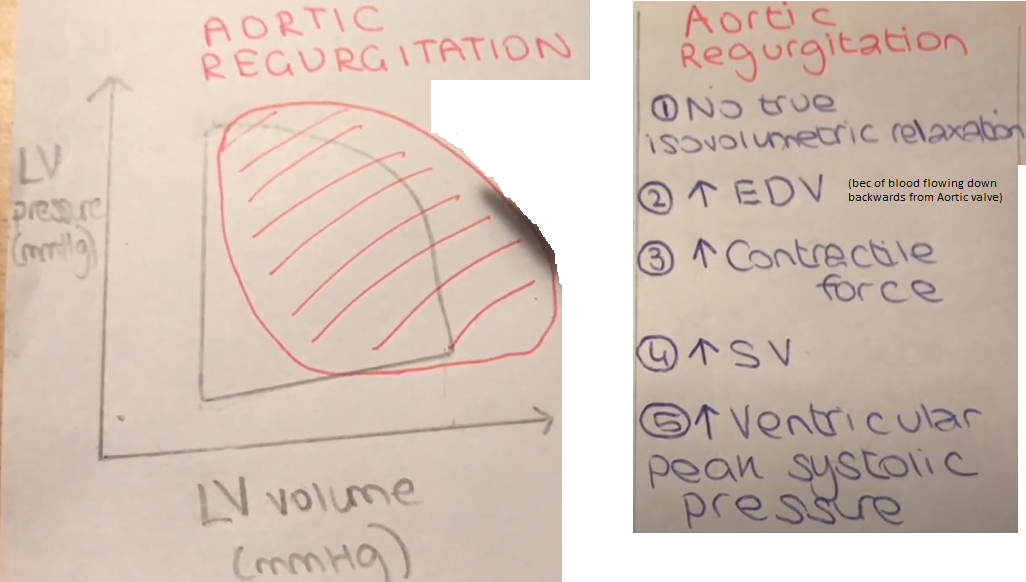
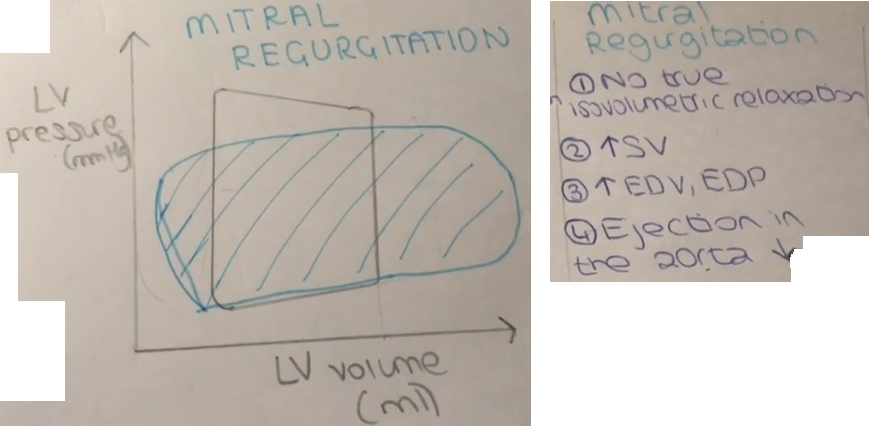
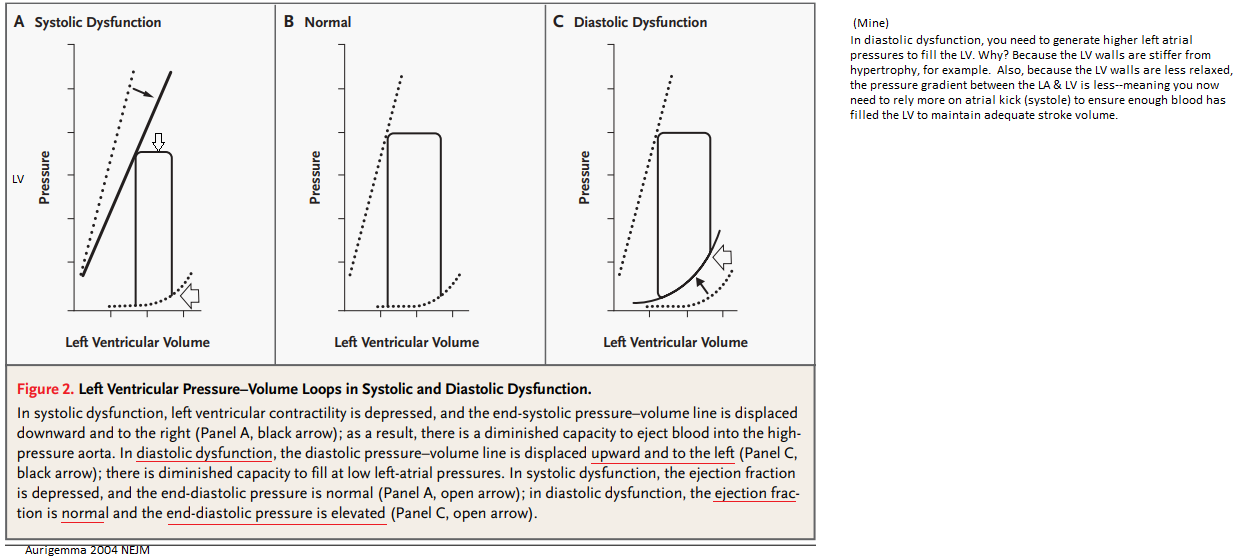
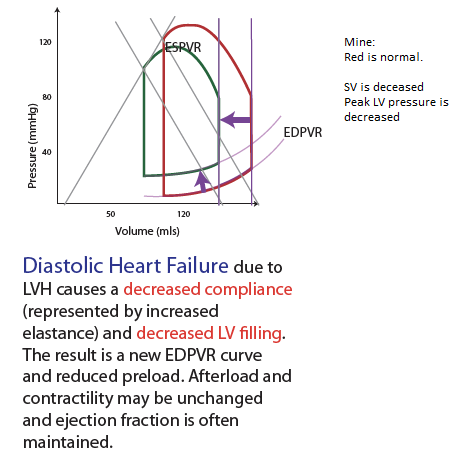
Note: stroke volume is diminished with systolic dysfunction.
Pulmonary edema in patients with diastolic heart failure is the direct consequence of increased passive chamber stiffness; the ventricle is unable to accept venous return adequately without high diastolic pressures. Such high filling pressures result in decreased lung compliance, which increases the work of breathing and contributes to dyspnea. [Zile 2004, NEJM]
What we recognize clinically as heart failure (elevated filling pressures and consequent pulmonary vascular congestion or peripheral edema) may be due either to systolic dysfunction of the left ventricle (observed as a left ventricular ejection fraction of < 50%) or to diastolic dysfunction of the left ventricle (observed as abnormal resistance to left ventricular filling during diastole), which results in elevation of the filling pressure, much as systolic dysfunction does. Diastolic dysfunction has been estimated to be the cause of clinical heart failure in 40 to 50% of patients, but any patient may have both systolic and diastolic dysfunction. Diastolic dysfunction can be classified according to factors intrinsic to the left ventricular myocardium, such as hypertrophy, infiltration with substances such as amyloid, or ischemia, which stiffens the myocardium. It may also be due to factors extrinsic to the myocardium, such as mitral stenosis or constrictive pericarditis. [Yurchak 2003 NEJM] Mine: the pericardium inflammation pushes against the LV, causing abnormal relaxation & stiffening--> resulting in the need for the LA to generate more LA pressure to squeeze blood down into the LV.
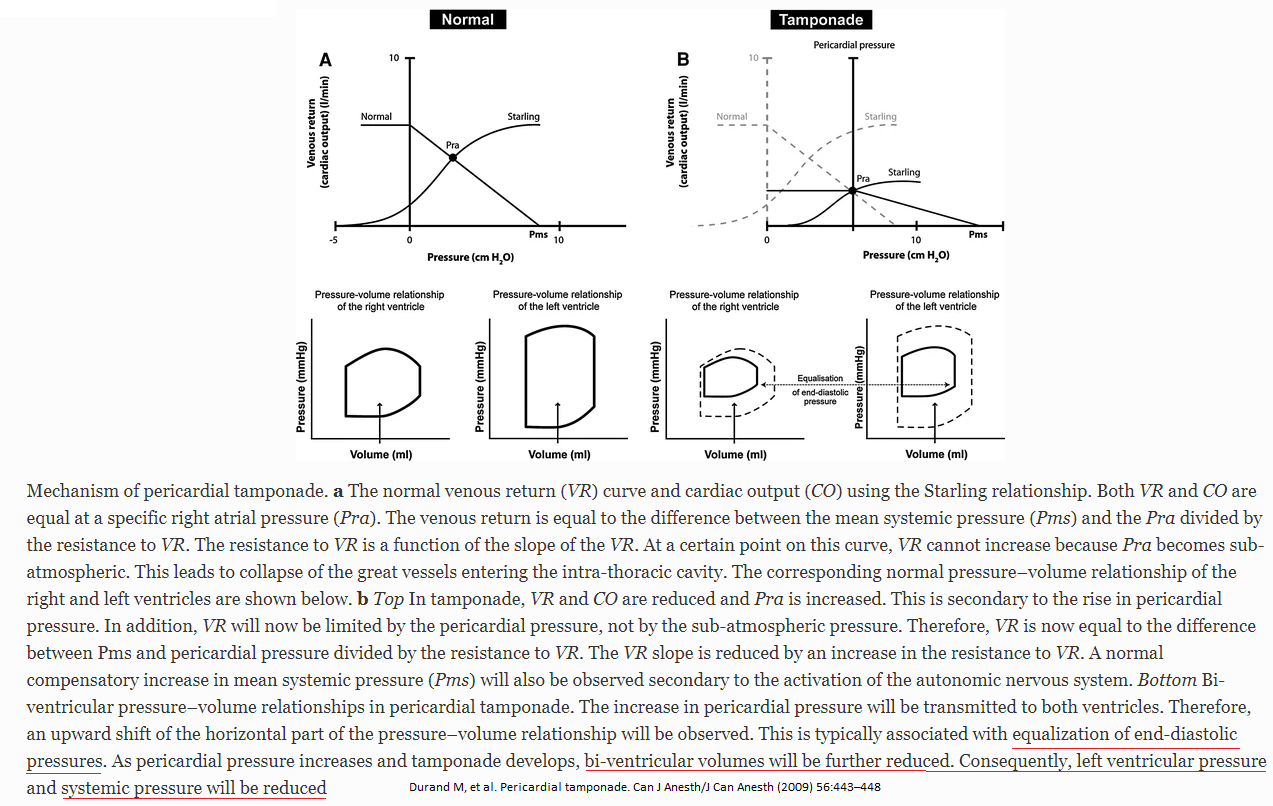
In constrictive pericarditis(CP), CP restriction is limited to late diastole, while it is throughout the diastole in cardiac tamponade. This is evident by the rapid 'y' descent, 'dip & plateau' pattern, and pressure equalization during late diastole in cases of CP. On the contrary, in cases involving cardiac tamponade, pressure equalization occurs throughout the diastole. Furthermore, unrestricted thoracic pressure transmission in cardiac tamponade contributes to a retained inspiratory rise in systemic venous return (absence of the Kussmaul sign) and respiratory variability in the right atrial pressure. The preferential inspirational filling of RV, therefore, is secondary to increased filling, rather than reduced left ventricular filling seen in CP
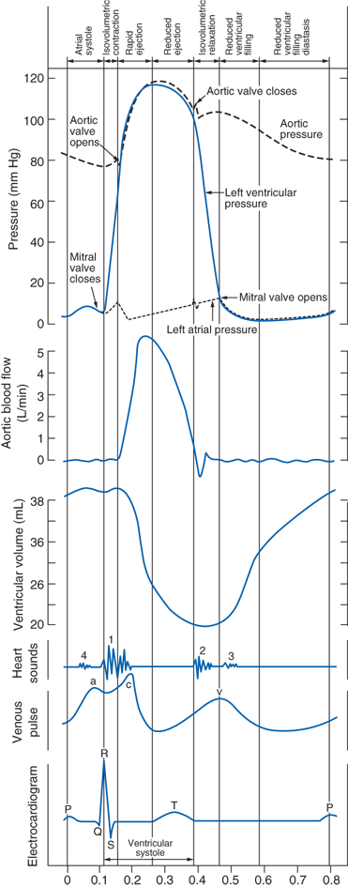
LV filling occurs during diastole, which has 4 phases: (1) isovolumic relaxation; (2) rapid filling phase; (3) slow filling, or diastasis; & (4) final filling during atrial systole (atrial kick.)
Cardiac Cycle
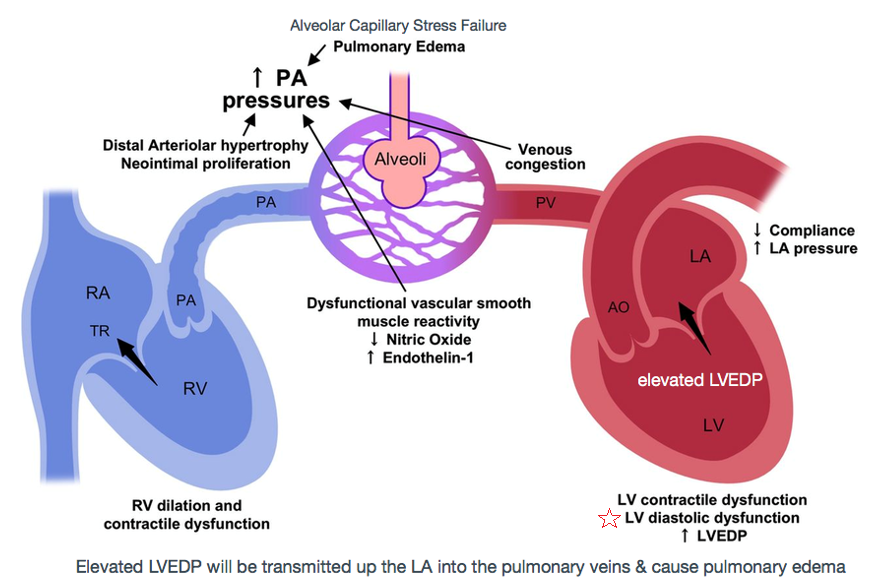
LV filling can become impaired & lead to heart failure with preserved ejection fraction (diastolic dysfunction.) Impaired LV relaxation decreases rapid filling [mine: by reducing the pressure gradient that can be generated between the LA & the LV] so more of the LVEDV must be derived from atrial systole. Reduced LV compliance causes increased LVEDP that can result in pulmonary edema [mine: the increased LVEDP is transmitted all the way up the LA & into the valveless pulmonary capillaries & the xs hydrostatic pressure within the pulm capillaries results in fluid leaking into the pulm alveoli].
LV compliance is dependent on myocardial characteristics (volume independent, such as hypertrophy) and chamber characteristics (volume dependent.) Causes of impaired LV filling include myocardial ischemia, which inhibits the amount of ATP available for isovolumic relaxation. LV hypertrophy from HTN, or chronic LVOT obstruction such as AS, is accompanied by increased fibrosis of the LV, decreasing the viscoelastic recoil properties of the heart.
Source: https://www.openanesthesia.org/lv_filling_physiology/
Hoit, B: Left Ventricular Diastolic Function Crit Care Med 2007; 35: 340-342.

Events during systole:
During systole, the aortic & pulmonic valves open to permit ejection into the aorta & pulmonary artery. The atrioventricular valves are closed during systole, therefore no blood is entering the ventricles; however, blood continues to enter the atria though the vena cavae & pulmonary veins.
Isovolumetric ventricular contraction
Isovolumetric contraction: LV pressure rises but LV volume is not changing; mitral & aortic valves are closed, awaiting aortic valve opening.
Isovolumetric relaxation: aortic valve is closed, awaiting mitral valve opening
Early ejection
Late ejection
Events during diastole:
Isovolumetric relaxation
Early rapid diastolic filling
Late slow diastolic filling
Atrial systole
Source: https://derangedphysiology.com/main/cicm-primary-exam/required-reading/cardiovascular-system/Chapter%20003/cardiac-cycle
The waveform used for this was acquired from Nakatani et al (1999). The whole point of that study was to determine whether the LA pressure could be assessed less invasively (i.e. with Doppler echo), but in order to prove this, these guys used a micromanometer-tipped catheter to directly measure the LA pressure in a group of patients who were undergoing cardiac surgery. "After calibrating relative to atmospheric pressure, the catheter was inserted from the right upper pulmonary vein into the LA". As these people were all mechanically ventilated and had diseased hearts by definition (in fact some were undergoing surgery for classical LA-inflating diseases such as MR), one should probably take these measurements with a grain of salt. The original authors' waveform recording was lightly vandalised and a bright red ventricular waveform was superimposed:

Yes, it looks a lot like the CVP waveform, and in fact it is even labelled the same. The sequence of events is:
Most Wiggers diagrams do not include left atrial volume, but perhaps they should, as the change in volume is probably at least as important as the change in pressure. Fortunately, somebody measured this for us - this time with 3D echo and cardiac MRI (Poutanen et al, 2000). Unfortunately, they measured it in children aged 8-13. The volume over time graph below was measured from a nine-year-old boy, which of course means that though the shape of the graph has meaning, the actual volume in mls is much smaller than that of the adult. To scale the volume axis accordingly, data were borrowed from the normal control population in a study of adult TOF patients by Riesenkampff et al (2010). This chimaera was then grafted onto the data from Nakamura et al to produce the hideous mutant below:

To fill in the blanks:
The latter phase is the much-spoken-of "atrial kick", which one loses with atrial fibrillation. How much blood is displaced by this? The total left atrial ejection fraction is usually said to be about 55% (Pellicori et al, 2013), but this is the difference between maximum and minimum atrial volume, and the actual amount of blood displaced by atrial contraction should be much smaller. It is said to be approximately 20% of the end-diastolic LV volume (Namana et al, 2018), or 24 ml for an average LVEDV of 120ml. For reference, normal LA volume ranges (indexed to BSA) are usually 19-41 ml/m2, or 36-77ml for a normal male with a BSA of 1.9 m2 (Aune et al, 2009).
Filling Pathology
Mitral Valve Stenosis
Mitral valve stenosis results from a narrowing of the opened mitral valve orifice so that it is more difficult for blood to flow from the LA into the LV during ventricular diastole (see figure below). The high resistance across the stenotic mitral valve causes blood to back up into the LA, thereby increasing LA pressure, which in this example is 25 mmHg (normally ~10 mmHg). This results in the LA pressure being much greater than the LV pressure during diastolic filling. If left ventricular maximal filled volume (end-diastolic volume) is reduced despite the elevated LA pressure, then the left ventricular end-diastolic pressure will be reduced as shown in the figure (6 mmHg compared to 10 mmHg in the normal heart). The LA enlarges (hypertrophies) over time because it has to generate higher than normal pressures when it contracts against the high resistance of the stenotic valve. The reduced ventricular filling (decreased preload) decreases ventricular stroke volume by the Frank-Starling mechanism. If stroke volume falls significantly, the reduced cardiac output may result in a reduction in aortic pressure (AP; 115/80 mmHg in this example), although compensatory mechanisms (e.g., systemic vasoconstriction) will attempt to maintain normal arterial pressure. Mitral valve stenosis is associated with a diastolic murmur because of turbulence that occurs as blood flows across the stenotic valve.
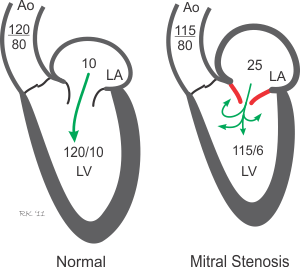
Source: https://www.cvphysiology.com/Heart%20Disease/HD004
Right Atrial Pressure
During normal respiration, RAP decreases with inspiration to the same degree as the drop in intrapleural pressure (usually <5 mm Hg) and generally reflects intrapericardial pressure in the absence of pericardial constraint. Lack of an inspiratory fall, or even rise in RAP with inspiration (e.g., Kussmaul sign), is indicative of right ventricle (RV) diastolic dysfunction & often RV overload.
Left ventricular (LV) stroke volume (SV) creates arterial pulse pressure (PP) by distending conducting vessels during systole, & systemic vascular resistance (SVR) preserves diastolic pressure (DP) by impeding SV from flowing through arterioles during diastole.
This coupling of ventricular & vascular elements allows rapid clinical separation of hypotensive pts into those with increased SV & cardiac output demonstrating bounding pulses with large PP, low DP, & warm digits (low SVR, high C.O. hypotension, or septic shock) from those who demonstrate thready pulses with small PP & cool digits signaling low SV & C.O. with increased SVR, as in cardiogenic or hypovolemic shock.
LV pumping function is described by relating LV end-DP as estimated by pulmonary wedge pressure (Ppw) to SV; LV dysfunction is signaled by increased Ppw & decreased SV & may be due to systolic or diastolic dysfunction.
Systolic dysfunction, or decreased contractility, connotes increased LV end-systolic volume for a given LV end-systolic pressure that is approximately the mean blood pressure (BP); common causes of acute systolic dysfunction in critical illness are myocardial ischemia, hypoxia, acidosis, sepsis, intercurrent negative inotropic drugs (β or calcium blockers), & acute-on-chronic systolic dysfunction in cardiomyopathies.
Diastolic dysfunction connotes decreased LV end-diastolic volume despite increased Ppw because the heart cannot fill normally; common causes of diastolic dysfunction in critical illness are pericardial tamponade or constriction, positive end-expiratory pressure (PEEP), or other causes of increased pleural pressure as in pneumothorax, pleural effusion, or abdominal distention, ventricular interdependence in acute right heart syndromes, & chronic LV stiffness as in LV hypertrophy.
Early differentiation between diastolic & systolic dysfunctions in critical illness is aided by a questioning approach & dynamic imaging such as echocardiography; this avoids inappropriate & ineffective therapy for the wrong etiology of LV dysfunction.
Venous return (VR) to the right atrium is controlled by mechanical characteristics of the systemic vessels (unstressed volume, vascular capacitance, vascular volume); together these determine the mean systemic pressure (Pms) responsible for driving VR back to the right atrium (Pra) through the resistance to VR.
For a given Pms, VR increases as Pra decreases to define the VR curve of the circulation, whereas SV & C.O. from the heart increase as Pra and preload increase to define the cardiac function curve that intersects the VR curve at a unique value of Pra where тVR= C.O.
When C.O. is insufficient, volume infusion, baroreceptors, or metabolic receptors can increase Pms to increase VR and Pra; this effect is mimicked by venoconstricting drugs such as norepinephrine or phenylephrine; alternatively, VR can be increased by positive inotropic (dobutamine) or afterload-reducing (sodium nitroprusside, fenoldopam) drugs that decrease Pra by enhancing cardiac function.
In hypovolemic shock, hemostasis & volume resuscitation are essential, whereas arteriolar constricting agents such as norepinephrine may be used briefly to provide a window of higher BP; in septic shock, considerable volume resuscitation is needed due to nitric oxide–mediated venodilation & decreased Pms, positive inotropic agents such as dobutamine treat the myocardial depression, & arterial vasoconstrictors such as norepinephrine may be needed to maintain BP despite high C.O. due to very low SVR.
In cardiogenic shock, preload reduction (morphine, nitroglycerin, furosemide) is effected by venodilation & decreased Pms, but VR often increases because cardiac function improves to decrease Pra; arterial dilating drugs often increase C.O. from the injured LV, so BP may even increase despite impaired contractility & C.O. without increasing myocardial O2 consumption when heart rate does not increase.
Early airway control & continuous mechanical ventilation decrease oxygen consumption & prevent respiratory acidosis but may decrease VR further in hypovolemic pts by raising pleural pressure & Pra; in cardiogenic shock, continuous mechanical ventilation & PEEP have less effect on VR and may increase C.O. by decreasing LV afterload.
Cardiogenic & low-pressure pulmonary edema are decreased by decreasing Ppw, & C.O. & oxygen delivery can be maintained at low Ppw with vasoactive drugs & blood transfusion; arterial oxygenation can be supported with PEEP without decreasing C.O. & oxygen delivery by effecting PEEP & tidal volumes that achieve 90% O2 saturation of an adequate hematocrit on a nontoxic fraction of inspired O2 without profound acidosis.
Source: cc31 The Pathophysiology of the Circulation in Critical Illness. Principles of Critical Care by Jesse Hall 2015