
Videos:
Augmented Limb Leads explained NL 7.13.21 --augmented unipolar limb leads
Reading a normal ECG
It’s normal sinus if:
p-wave is (+) in II; initially (+), then (-) in V1
Normal qrs axis if:
QRS is more (+) than (-) in I, II
PR interval: should be < 1 major box
QT interval: usu 320 - 500 msec
prolonged if QT interval is > half of the R-R interval
T-waves: acceptable to have t-wave inversion in V1; in V2-V6, t-wave should be (+)


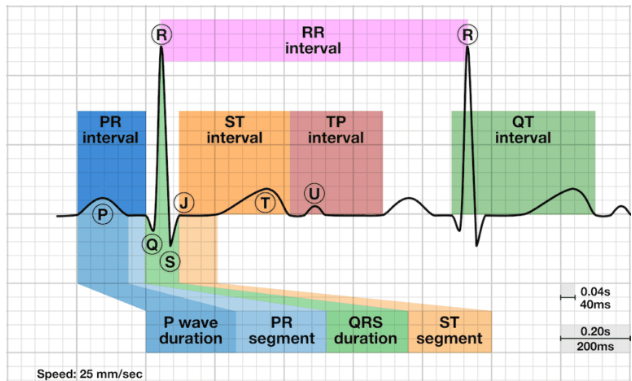
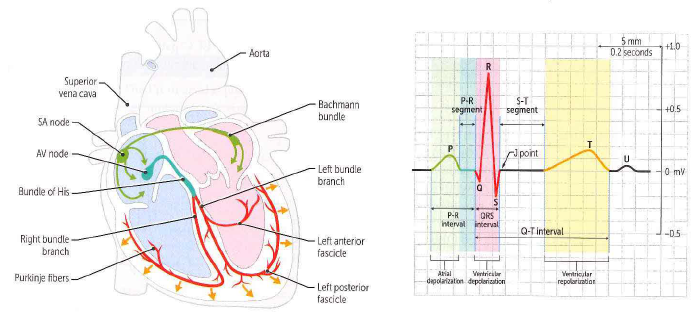
ST segment: The line between the QRS complex and the T wave, representing the time when the ventricles are depolarized before repolarization begins.
The J point denotes the junction of the QRS complex &the ST segment on the ECG, marking the end of depolarization & beginning of repolarization.
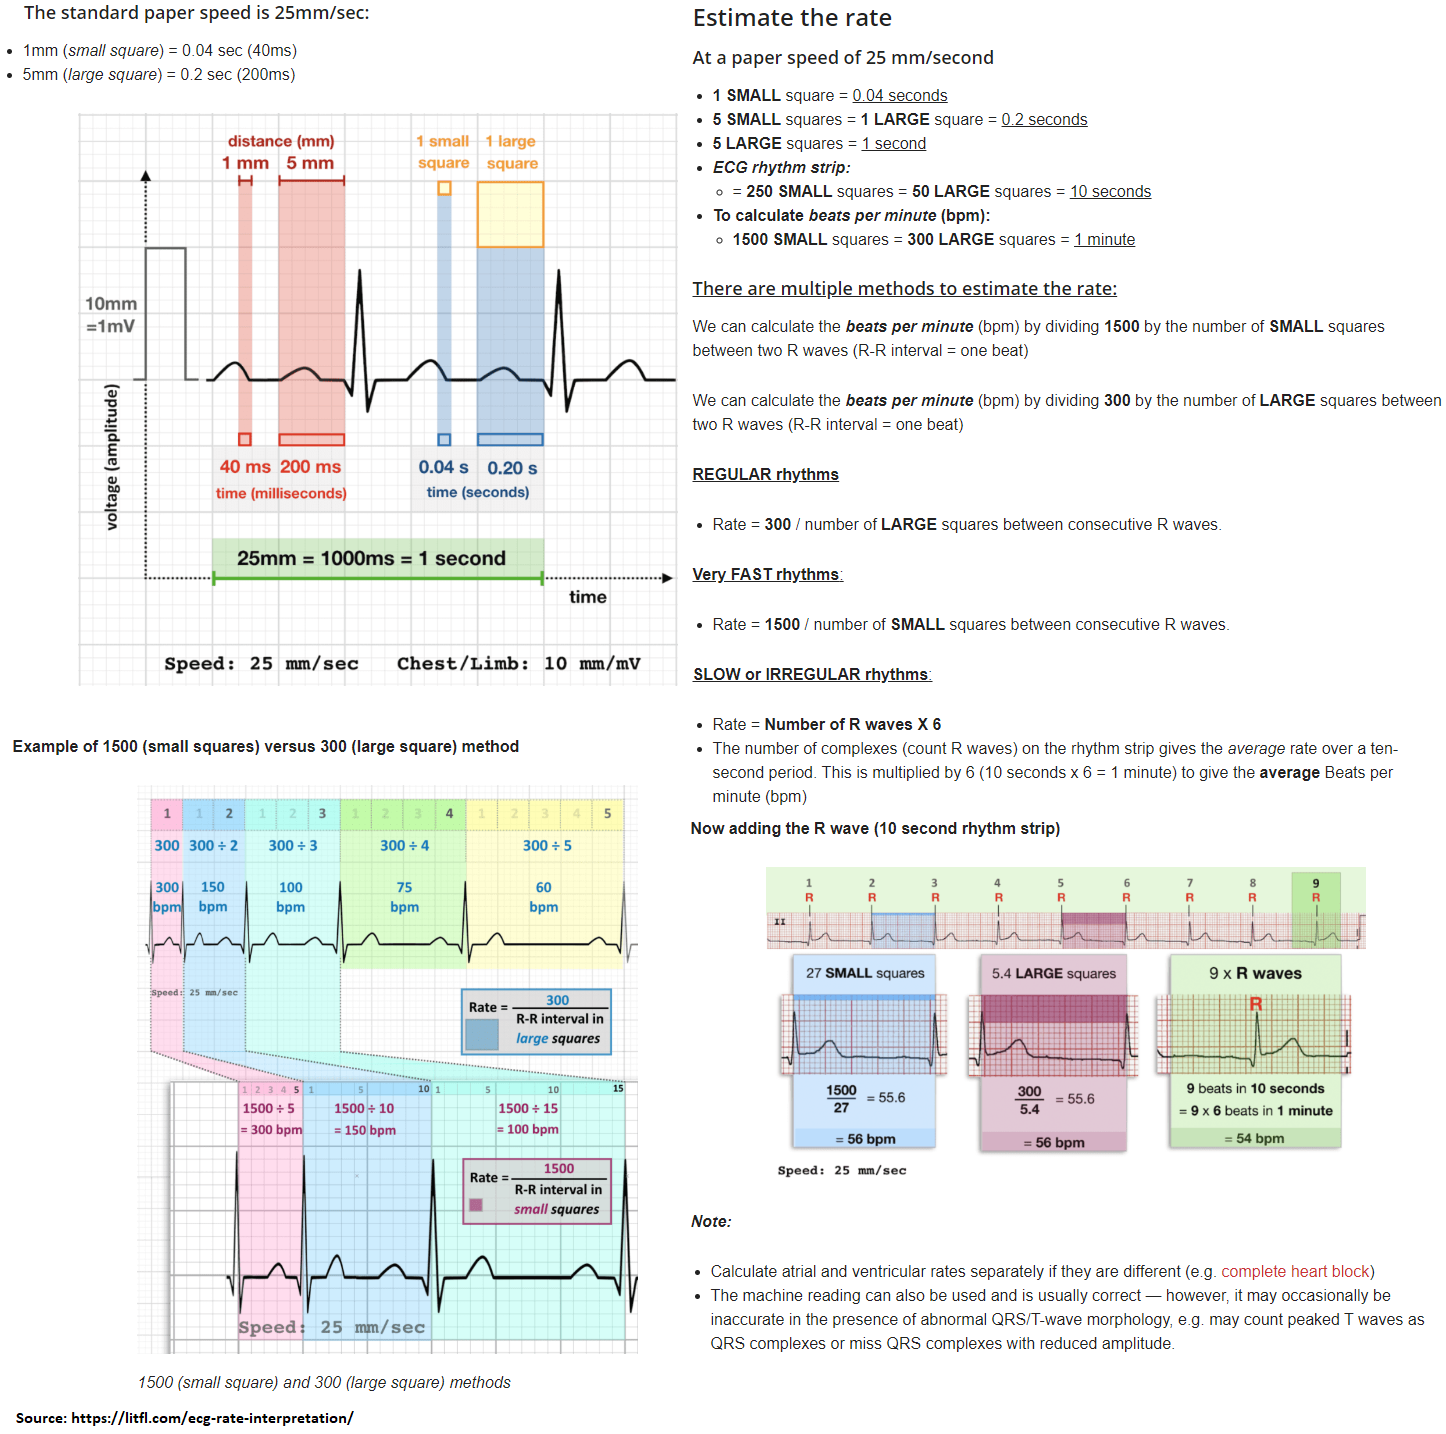
The P wave is a small deflection wave that represents atrial depolarization.
The PR interval is the time between the first deflection of the P wave and the first deflection of the QRS complex.
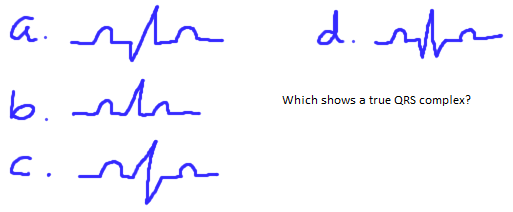
The three waves of the QRS complex represent ventricular depolarization. For the inexperienced, one of the most confusing aspects of ECG reading is the labeling of these waves. The rule is: if the wave immediately after the P wave is an upward deflection, it is an R wave; if it is a downward deflection, it is a Q wave:
small Q waves correspond to depolarization of the interventricular septum. Q waves can also relate to breathing and are generally small and thin. They can also signal an old myocardial infarction (in which case they are big & wide)
the R wave reflects depolarization of the main mass of the ventricles –hence it is the largest wave
the S wave signifies the final depolarization of the ventricles, at the base of the heart
The ST segment, which is also known as the ST interval, is the time between the end of the QRS complex and the start of the T wave. It reflects the period of zero potential between ventricular depolarization and repolarization.
T waves represent ventricular repolarization (atrial repolarization is obscured by the large QRS complex).
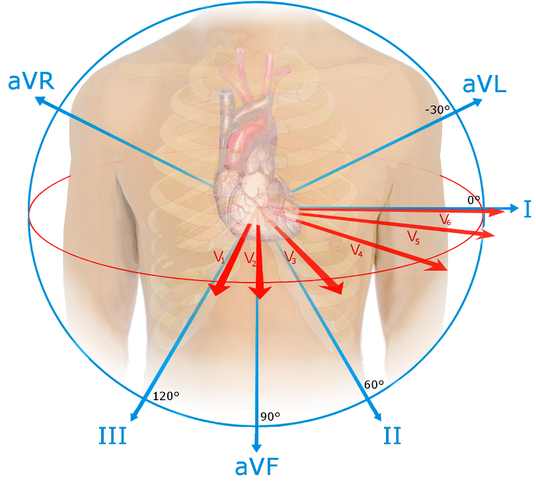
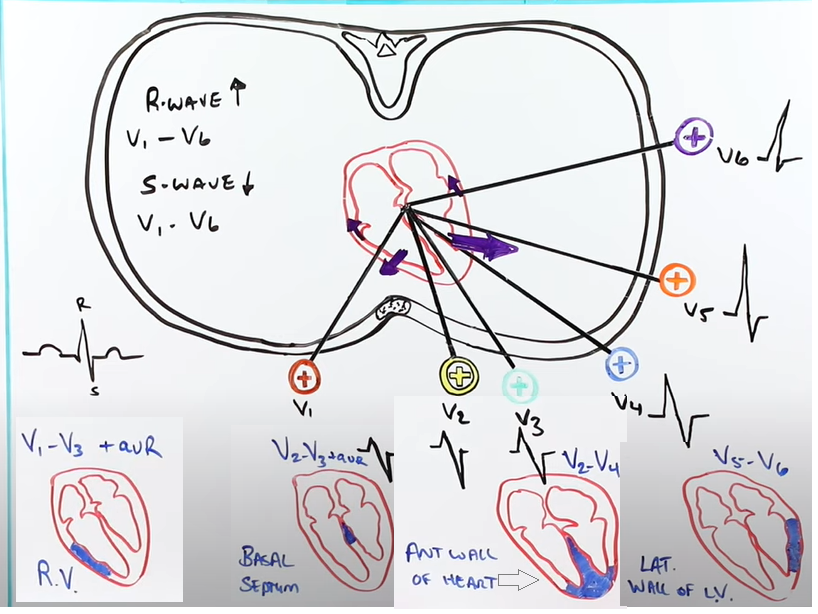
Since the direction of a deflection, upward or downward, is dependent on whether the electrical activity is going towards or away from a lead, it differs according to the orientation of the lead with respect to the heart (see Figure 5).
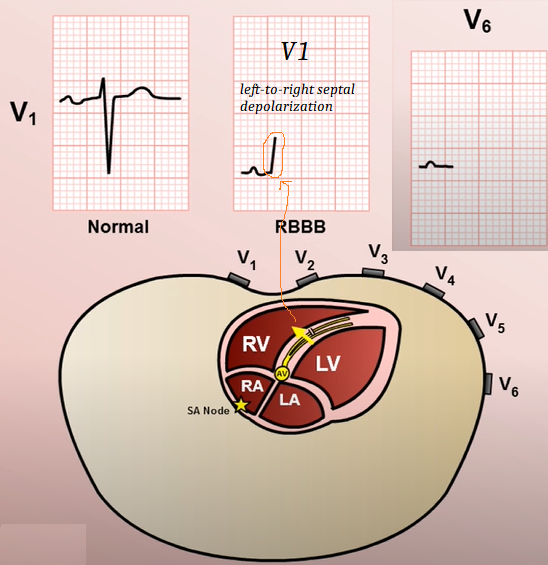
(a) A horizontal section through the chest showing the orientation of the chest leads with respect to the chambers of the heart. (b) In lead V1, depolarization of the interventricular septum occurs towards the lead, thus creating an upward deflection (more...)
The ECG trace reflects the net electrical activity at a given moment. Consequently, activity in one direction is masked if there is more activity, eg, by a larger mass, in the other direction. For example, the left ventricle muscle mass is much greater than the right, and therefore its depolarization accounts for the direction of the biggest wave.
Source: Conquering the ECG - Cardiology Explained - NCBI Bookshelf (nih.gov) https://www.ncbi.nlm.nih.gov/books/NBK2214/
P-waves
Differential diagnosis of negative P wave in lead I includes: right arm–left arm lead reversal, mirror-image dextrocardia, & left atrial rhythm.
QRS Complex
The 3 waves of the QRS complex represent ventricular depolarization.
R wave reflects depolarization of the main mass of the ventricles –hence it is the largest wave.
S wave signifies the final depolarization of the ventricles, at the base of the heart.
The S wave is deepest in the right precordial leads, usually in lead V2. The S wave amplitude decreases as the left precordium is approached. Although the upper limits of the S wave amplitude in leads V1, V2, and V3 have been given as 1.8, 2.6, and 2.1 mV, respectively, an amplitude of 3.0 mV is recorded occasionally in healthy individuals. An S wave is often absent in leads V5 & V6. An S wave of less than 0.3 mV in lead V1 is considered abnormally small.
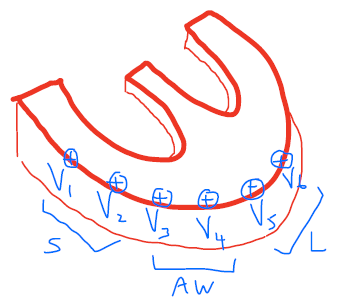
In right chest leads V1 & V2, the QRS complexes are predominantly negative with small R waves and relatively deep S waves because the more muscular left ventricle produces depolarization current flowing away from these leads. The QRS complexes in V3 and V4 reflect a transition between the right and left chest leads.
Precordial Leads
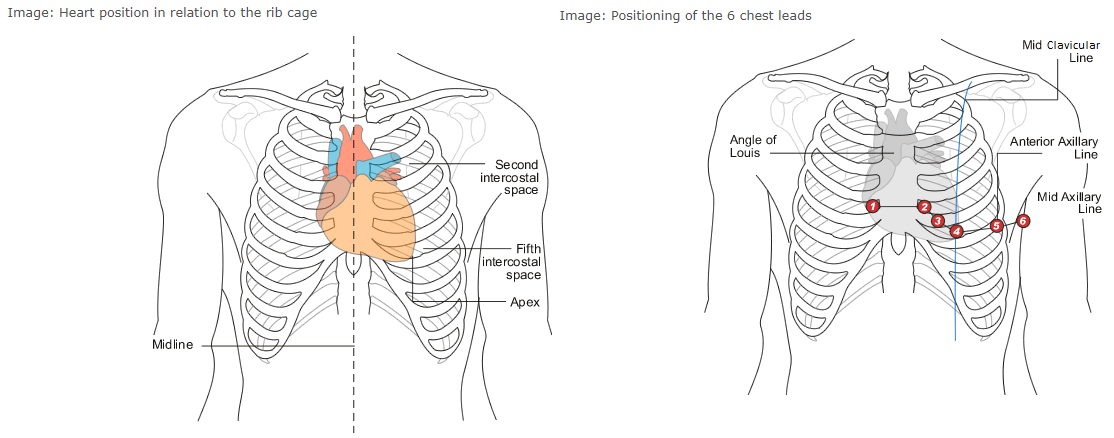
The 6 leads are labelled as "V" leads and numbered V1 to V6. They are positioned in specific positions on the rib cage. To position then accurately it is important to be able to identify the "angle of Louis", or "sternal angle".
To find it on yourself, place your fingers gently at the base of your throat in a central position and move your fingers downward until you can feel the top of the sternum, or rib cage. From this position, continue to move your fingers downward until you feel a boney lump. This is the "angle of Louis".
The angle of Louis is most easily found when the patient is lying down as the surrounding tissue is tighter against the rib cage.
From the angle of Louis, move your fingers to the right and you will feel a gap between the ribs. This gap is the 2nd Intercostal space. From this position, run your fingers downward across the next rib, and the next one. The space you are in is the 4th intercostal space. Where this space meets the sternum is the position for V1.
Go back to the "angle of Louis" and move into the 2nd intercostal space on the left. Move down over the next 2 ribs and you have found the 4th intercostal space. Where this space meets the sternum is the position for V2.
From this position, slide your fingers downward over the next rib and you are in the 5th intercostal space . Now look at the chest and identify the left clavicle, a bone that runs from the left shoulder to the top of the sternum. The position for V4 is in the 5th intercostal space , in line with the middle of the clavicle (mid-clavicular). V3 sits midway between V2 and V4.
Follow the 5th intercostal space to the left until your fingers are immediately below the beginning of the axilla, or under-arm area. This is the position for V5.
Follow this line of the 5th intercostal space a little further until you are immediately below the center point of the axilla, (mid-axilla). This is the position for V6.
Why Upward Deflection vs Downward Deflection
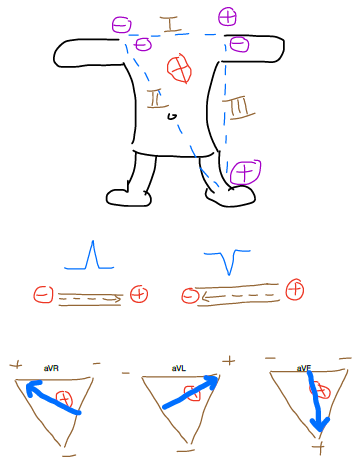
During DEpolarization, if (+) wave is heading toward (+) electrode --> upward deflection
If (-) wave is heading toward (-) electrode --> upward deflection: this explains why repolarization causes upright T-wave on ECG
During depolarization, the myocardial cells are all starting to be (-) again; this (-) wave heads back up (starting from heart's apex) towards the (-) end of lead II, causing an upward deflection which inscribes the T-wave. (mine)
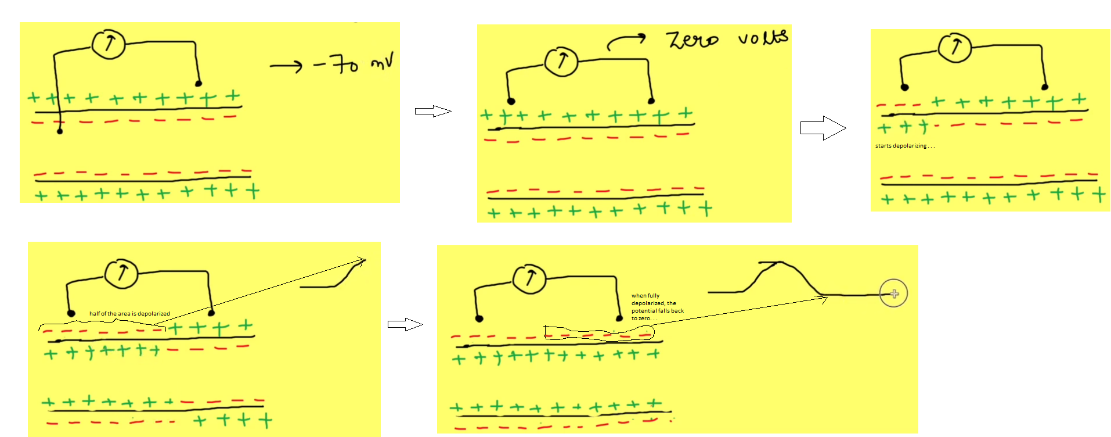
ST Segment
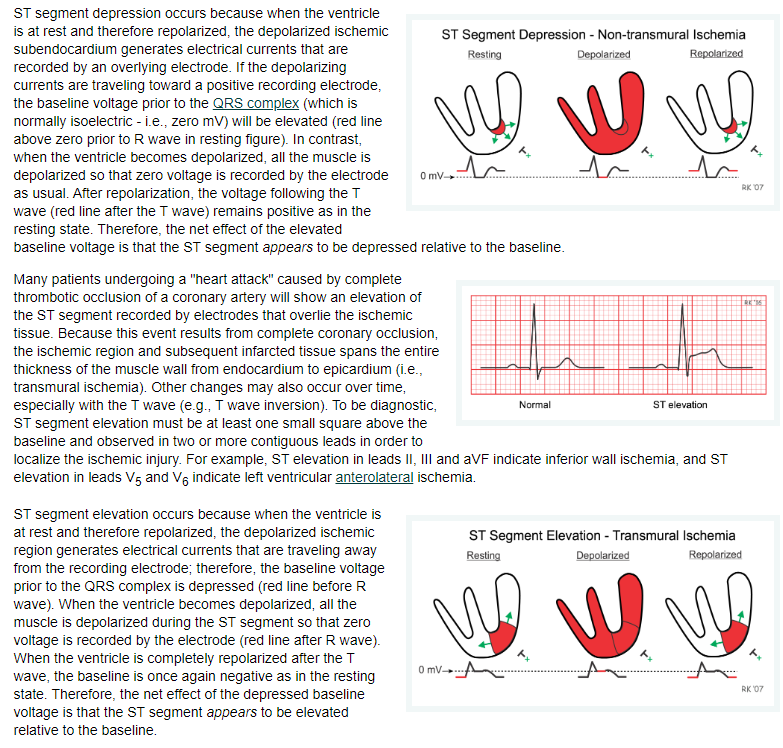
Source:
https://www.cvphysiology.com/CAD/CAD012
T-waves
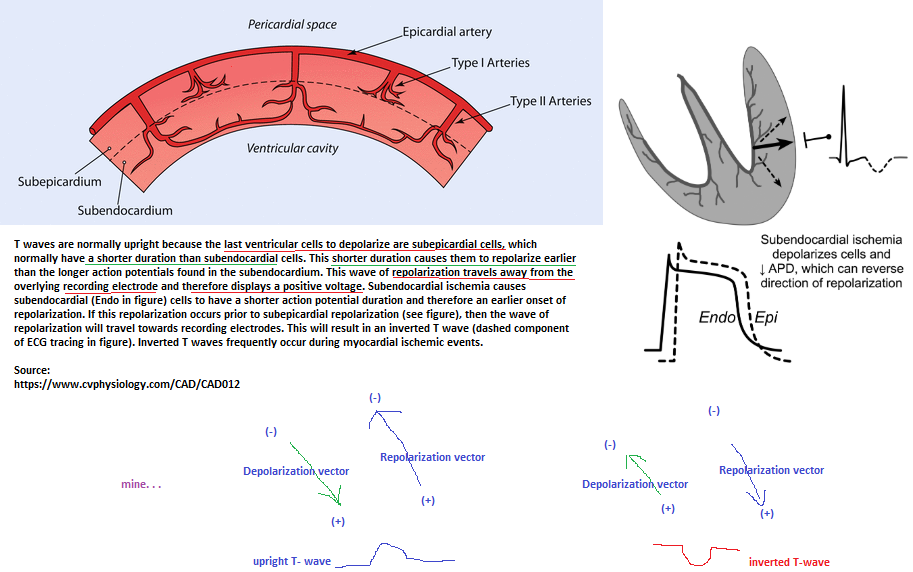
Video: Explaining why T-wave is upright using dipole moments
also:
If (+) wave is heading toward (+) electrode --> upward deflection
If (-) wave is heading toward (-) electrode --> upward deflection: this explains why repolarization causes upright T-wave on ECG
During depolarization, the myocardial cells are all starting to be (-) again; this (-) wave heads back up (starting from heart's apex) towards the (-) end of lead II, causing an upward deflection which inscribes the T-wave. (mine)
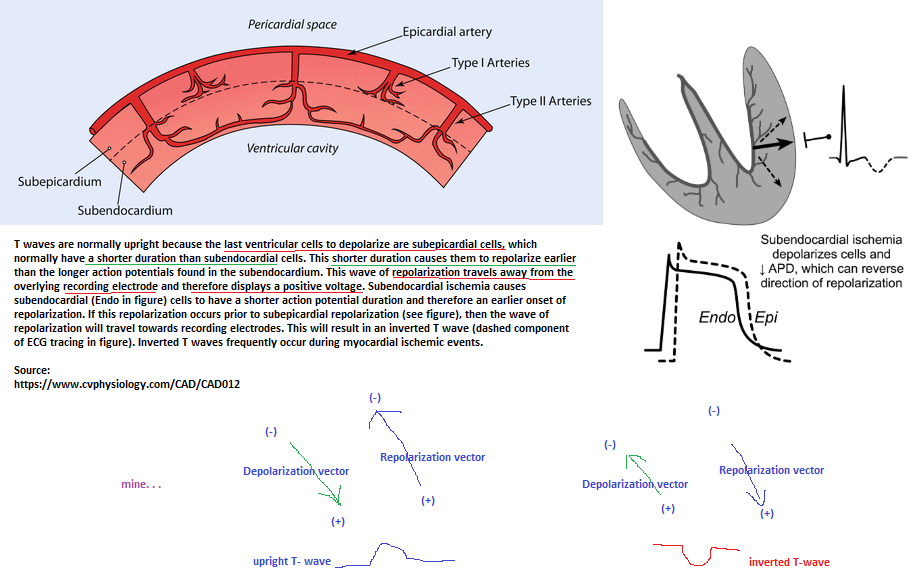
Video: Why T-wave is upright in ECG -- NL
ECG electrodes sense the relative charge on the OUTSIDE of cells, not the inside of cells.
Mine: During repolarization, the epicardial cells (not the endocardial cells) repolarize 1st , a propagating (+) wave (the electrode senses the outside environment's charge & NOT the inside environment's charge--due to the cell membrane insulating the inside charge from being sensed by the electrodes ) heads upward towards the base of the ventricles towards the (-) electrode of lead II. A (+) wave propagating towards a (-) electrode causes an upward deflection of the T-wave. Recall that during depolarization, a propagating (-) wave (i.e., electrode senses the outside's relatively (-) charge) heads towards the (+) electrode of lead II, causing the p-wave to be upwardly deflected (i.e., (+)).
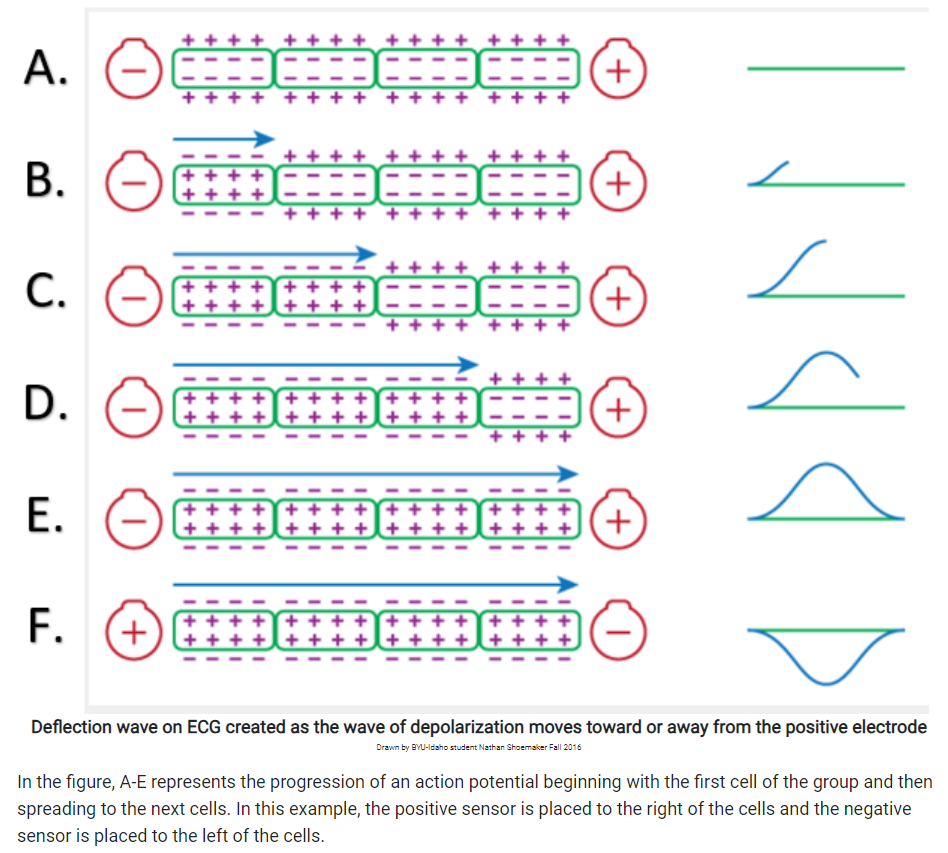
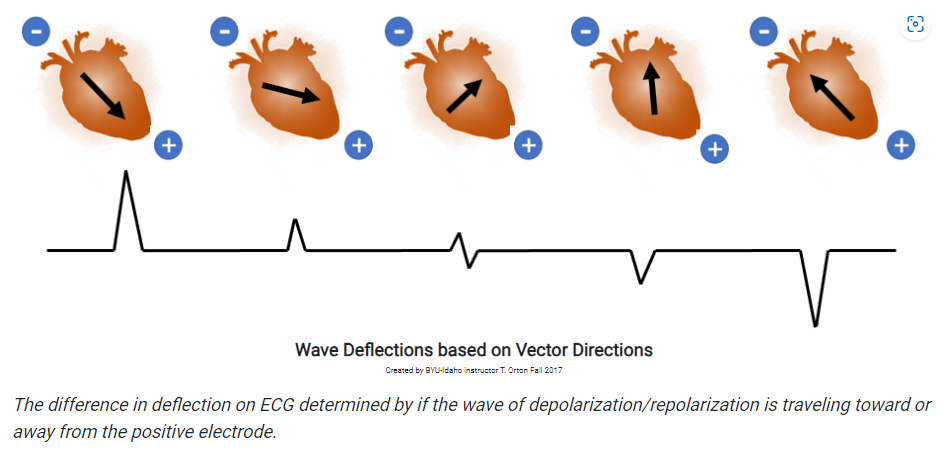

Source: Introduction to the ECG (stjohnwa.com.au); https://clinical.stjohnwa.com.au/medical-library/ecg-library/introduction-overview/introduction-to-the-ecg
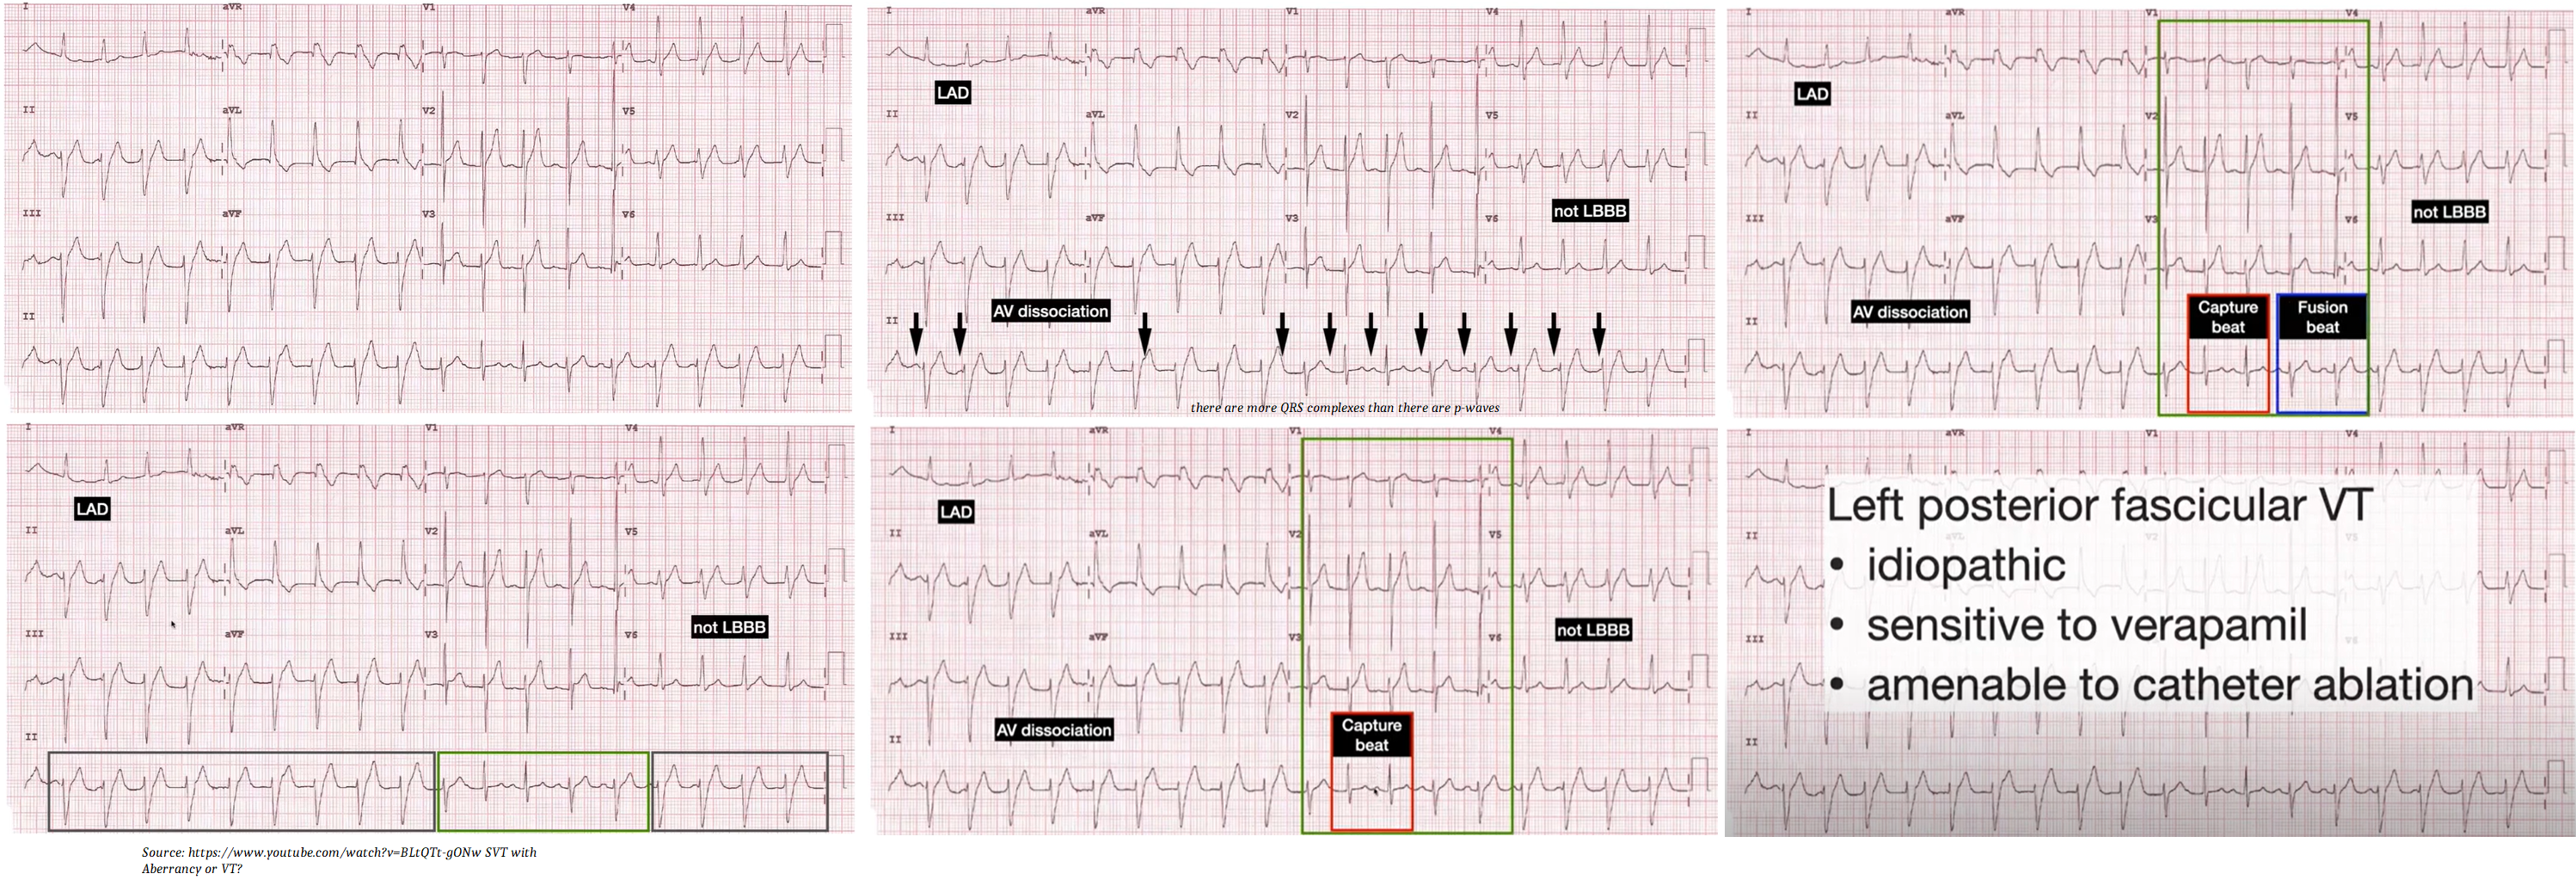
Capture Beats
Describes a beat that is of normal sinus rhythm in the midst of VT, as the SA node “captures” the normal cardiac conduction pathway. It therefore excludes SVT as there must be normal conduction above the AV node.
Video:
Axis Deviations
Right axis deviation and right bundle branch block pattern are ECG findings that are associated with PE. The acute increase in pulmonary vascular resistance due to pulmonary artery clot burden and the pulmonary artery constriction induced by significant hypoxemia can result in dilatation of the right atrium and ventricle. This dilatation can shift the QRS axis to the right and delay impulse conduction through the right ventricular myocardium.
ECG abnormalities in cor pulmonale reflect the presence of right ventricular hypertrophy (RVH), RV strain, or underlying pulmonary dz. Such ECG changes may include right axis deviation.
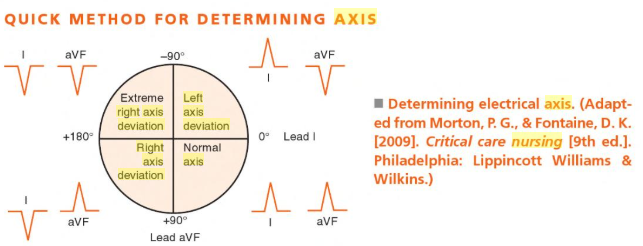
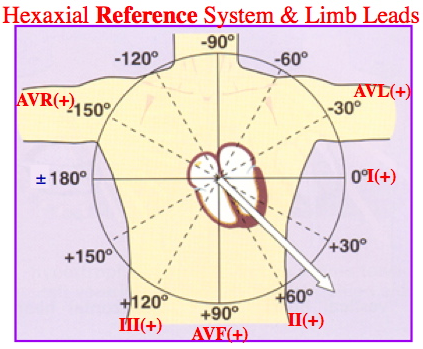
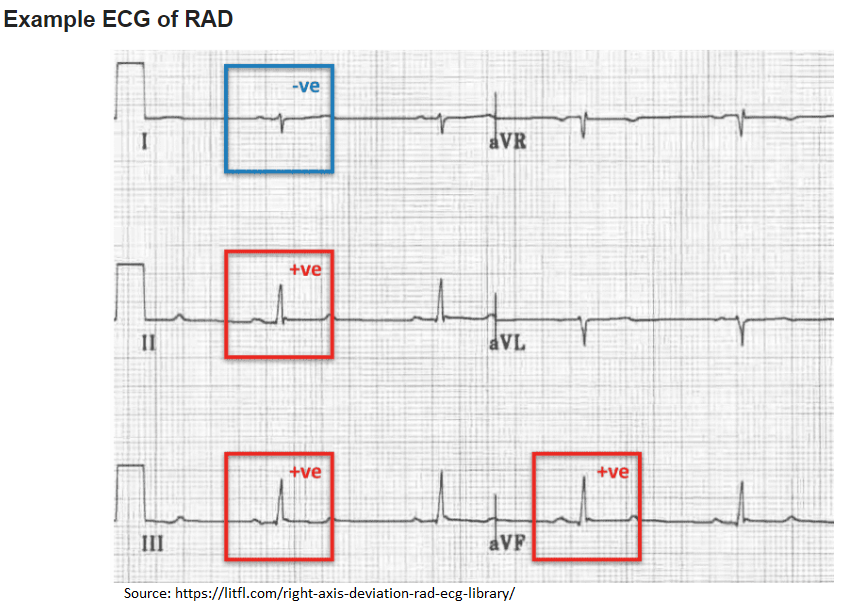
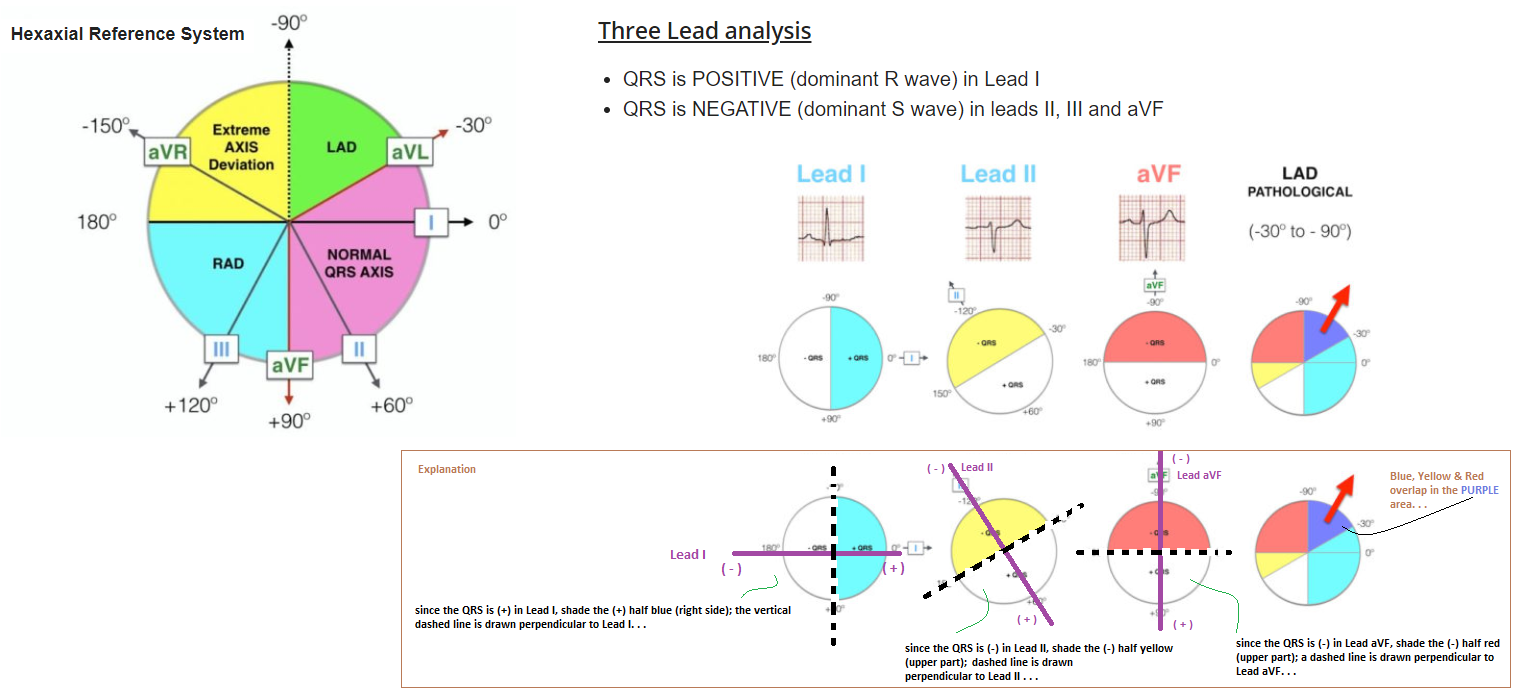
Right axis deviation occurs when the QRS axis is shifted between 90 and 180 degrees. Things can result in right axis deviation include: lung disease, right sided heart strain, RBBB, & right ventricular hypertrophy.
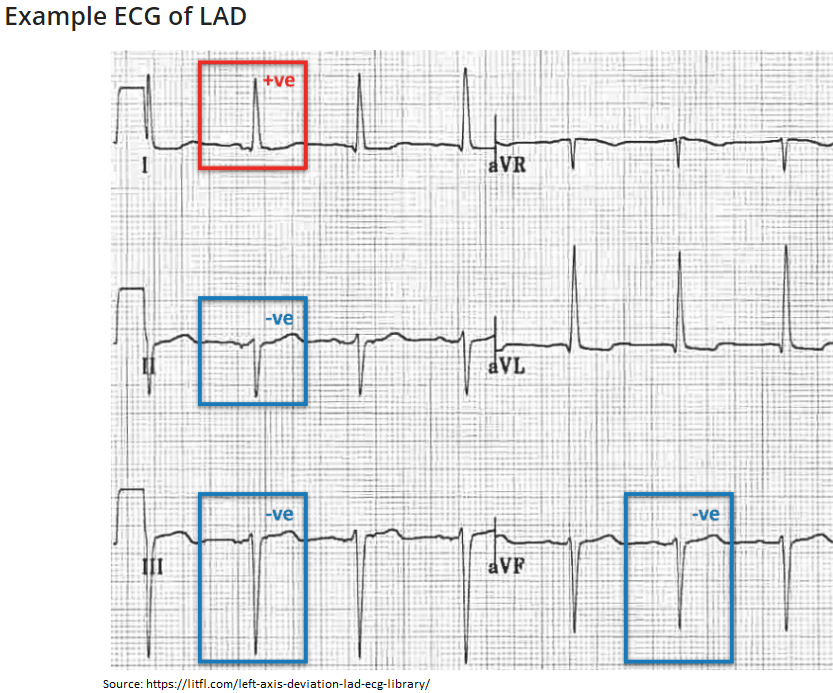
AXIS DETERMINATION
DDx Right Axis Deviation:
Right ventricular hypertrophy, Left posterior fascicular block, Lateral myocardial infarction, Acute lung disease (e.g. Pulmonary Embolus), Chronic lung disease (e.g. COPD), Ventricular ectopy, Hyperkalaemia, Sodium-channel blocker toxicity, WPW syndrome
Normal in children or thin adults with a horizontally positioned heart
DDx Left Axis Deviation:
Left ventricular hypertrophy, Left anterior fascicular block, Left bundle branch block, Inferior MI, Ventricular ectopy, Paced rhythm, Wolff-Parkinson White syndrome
RBBB
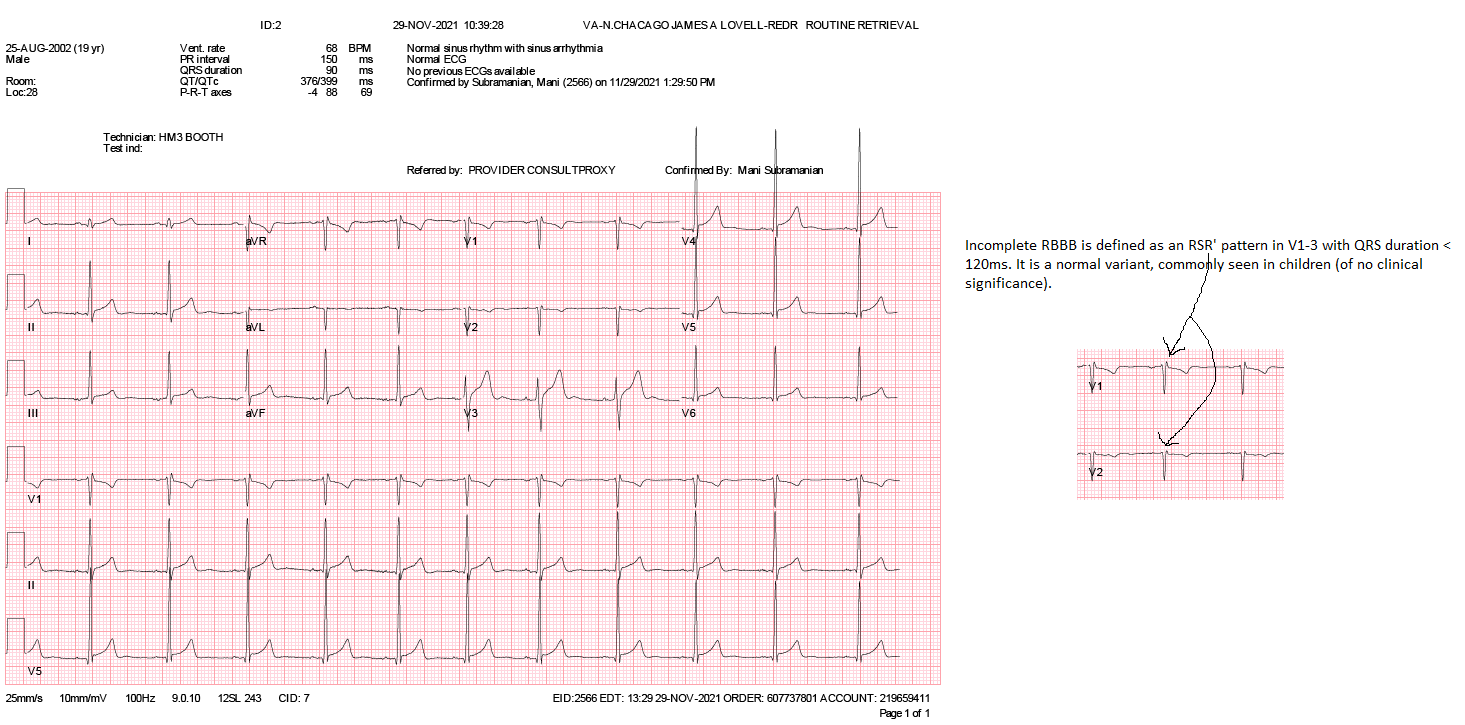
Incomplete RBBB (see below ECG) is defined as an RSR' pattern in V1-3 with QRS duration < 120ms. It is a normal variant, commonly seen in children (of no clinical significance).
QT interval
Represents the time it takes for the electrical system to fire an impulse through the ventricles and then recharge. The time it takes for the heart muscle to contract and then recover.
Fluoroquinolones (FQ) (respiratory FQs are: levofloxacin and moxifloxacin) are some of the most common QT-prolonging medications prescribed to hemodialysis patients.
QT interval is the time from the beginning of the QRS complex, representing ventricular depolarization, to the end of the T wave, resulting from ventricular repolarization.
The normal QT interval is controversial, and multiple normal durations have been reported. In general, the normal QT interval is below 400 to 440 milliseconds (ms), or 0.4 to 0.44 seconds. Women have a longer QT interval than men. Lower heart rates also result in a longer QT interval.
A quick way to distinguish a prolonged QT interval is to examine if the T wave ends beyond the halfway point between the RR interval. If the T wave ends past the halfway point of the RR interval, it is prolonged.
QT Interval
How to measure the QT interval
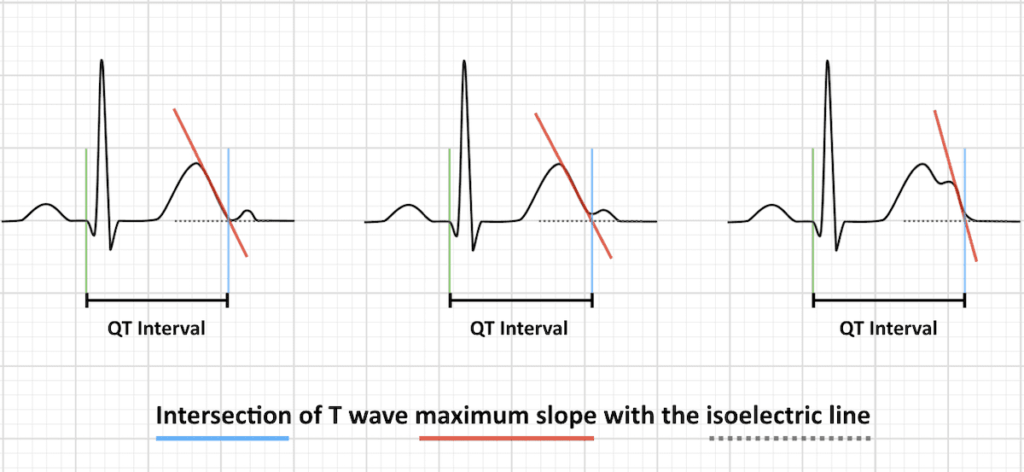
The QT interval is defined from the beginning of the QRS complex to the end of the T wave. The maximum slope intercept method defines the end of the T wave as the intercept between the isoelectric line with the tangent drawn through the maximum down slope of the T wave (left).
When notched T waves are present (right), the QT interval is measured from the beginning of the QRS complex extending to the intersection point between the isoelectric line and the tangent drawn from the maximum down slope of the second notch, T2.
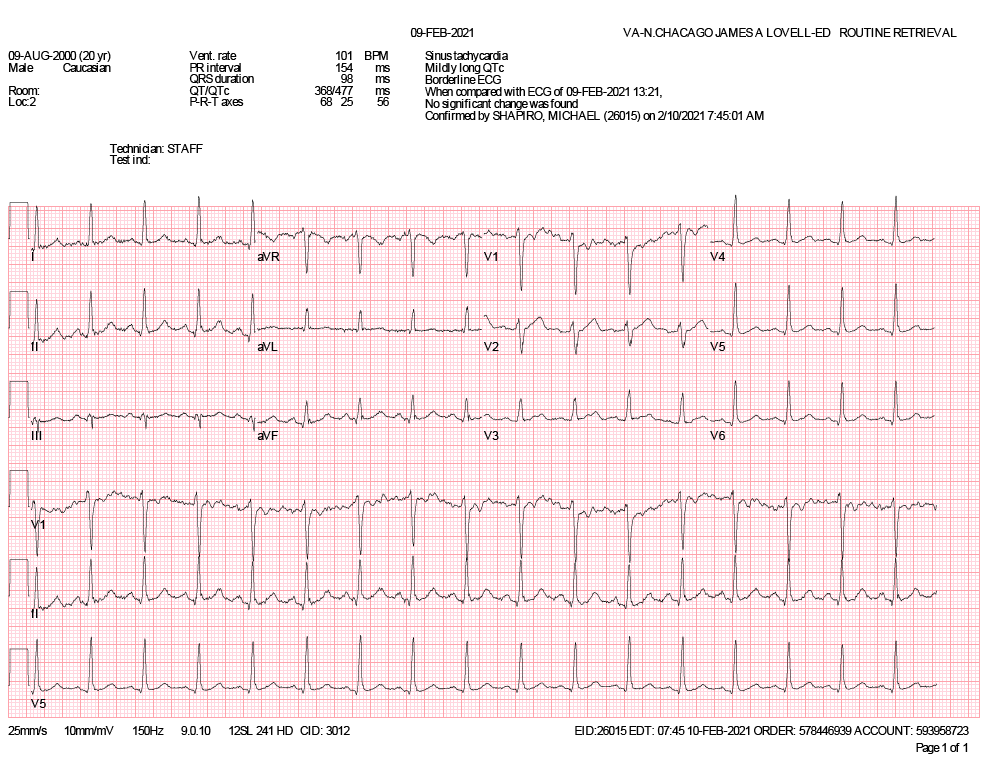
Denies being on anti-psychotics, anti-depressants, antihistamines, macrolides or anti-arrythmics.
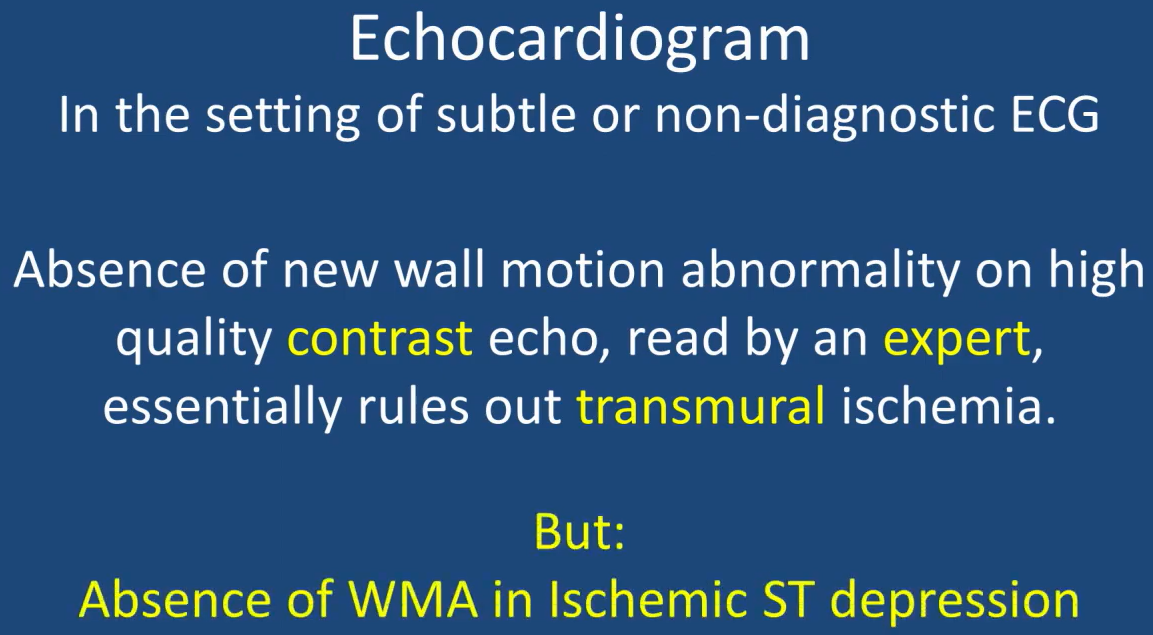
MI
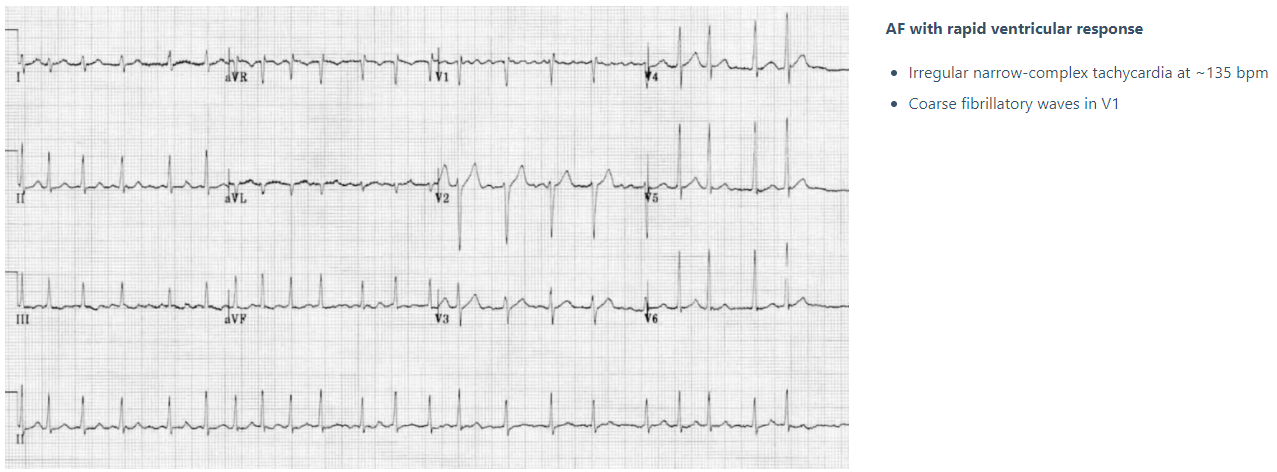
Atrial Fibrillation

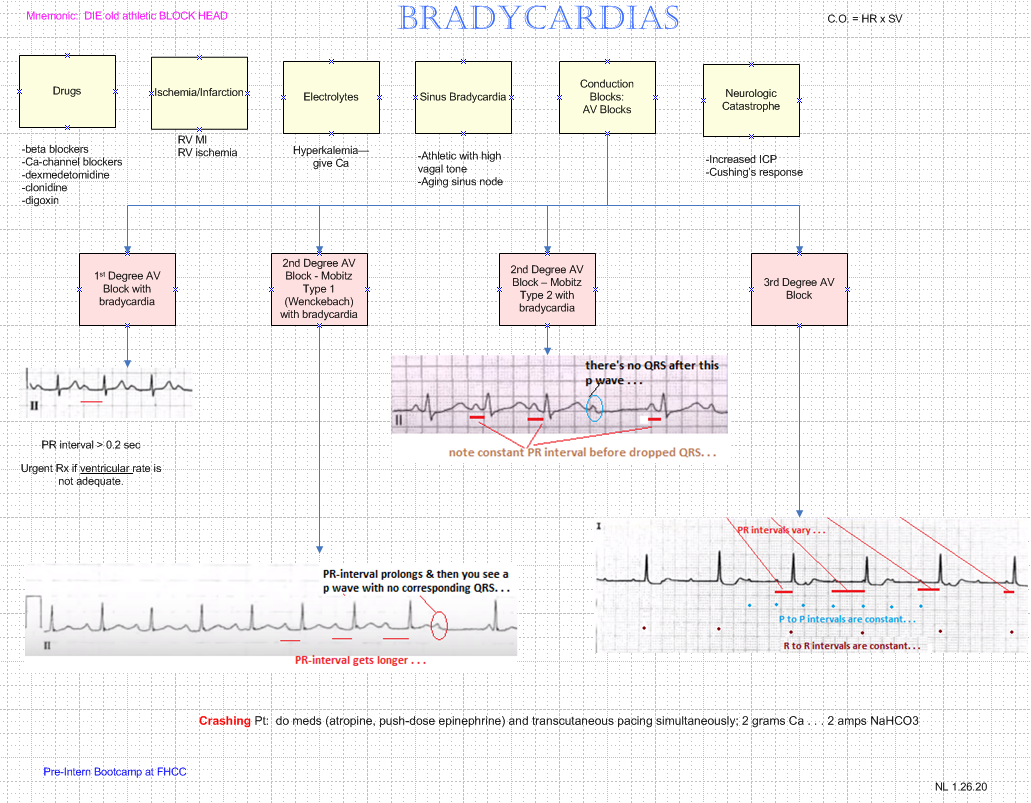
Bradycardias
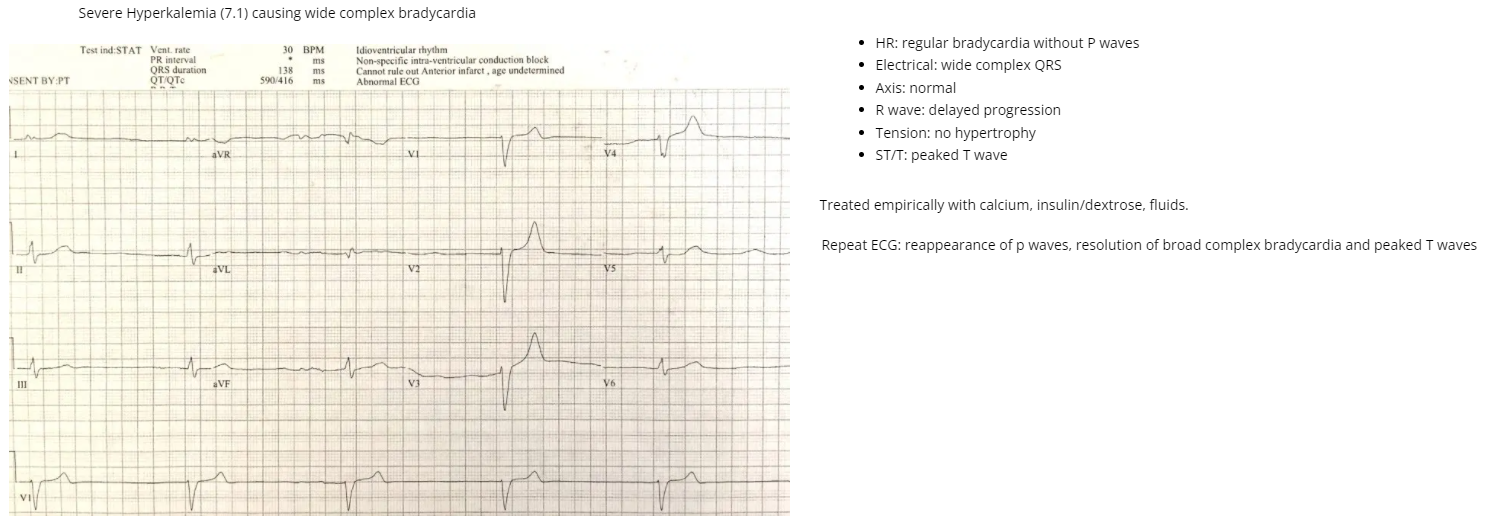
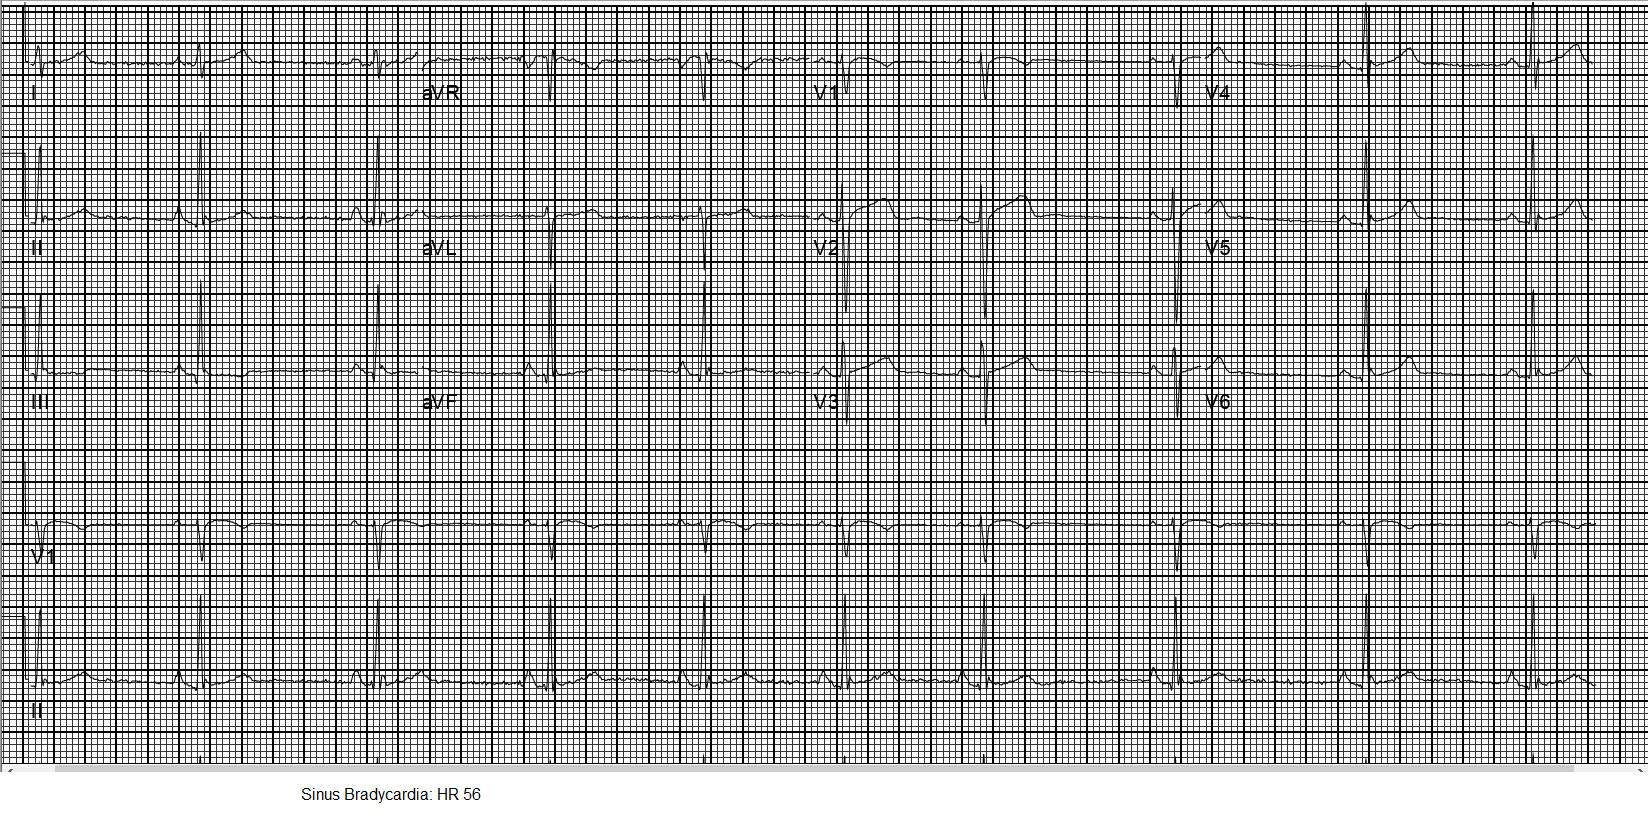
Sinus Bradycardia
Atrial Enlargement
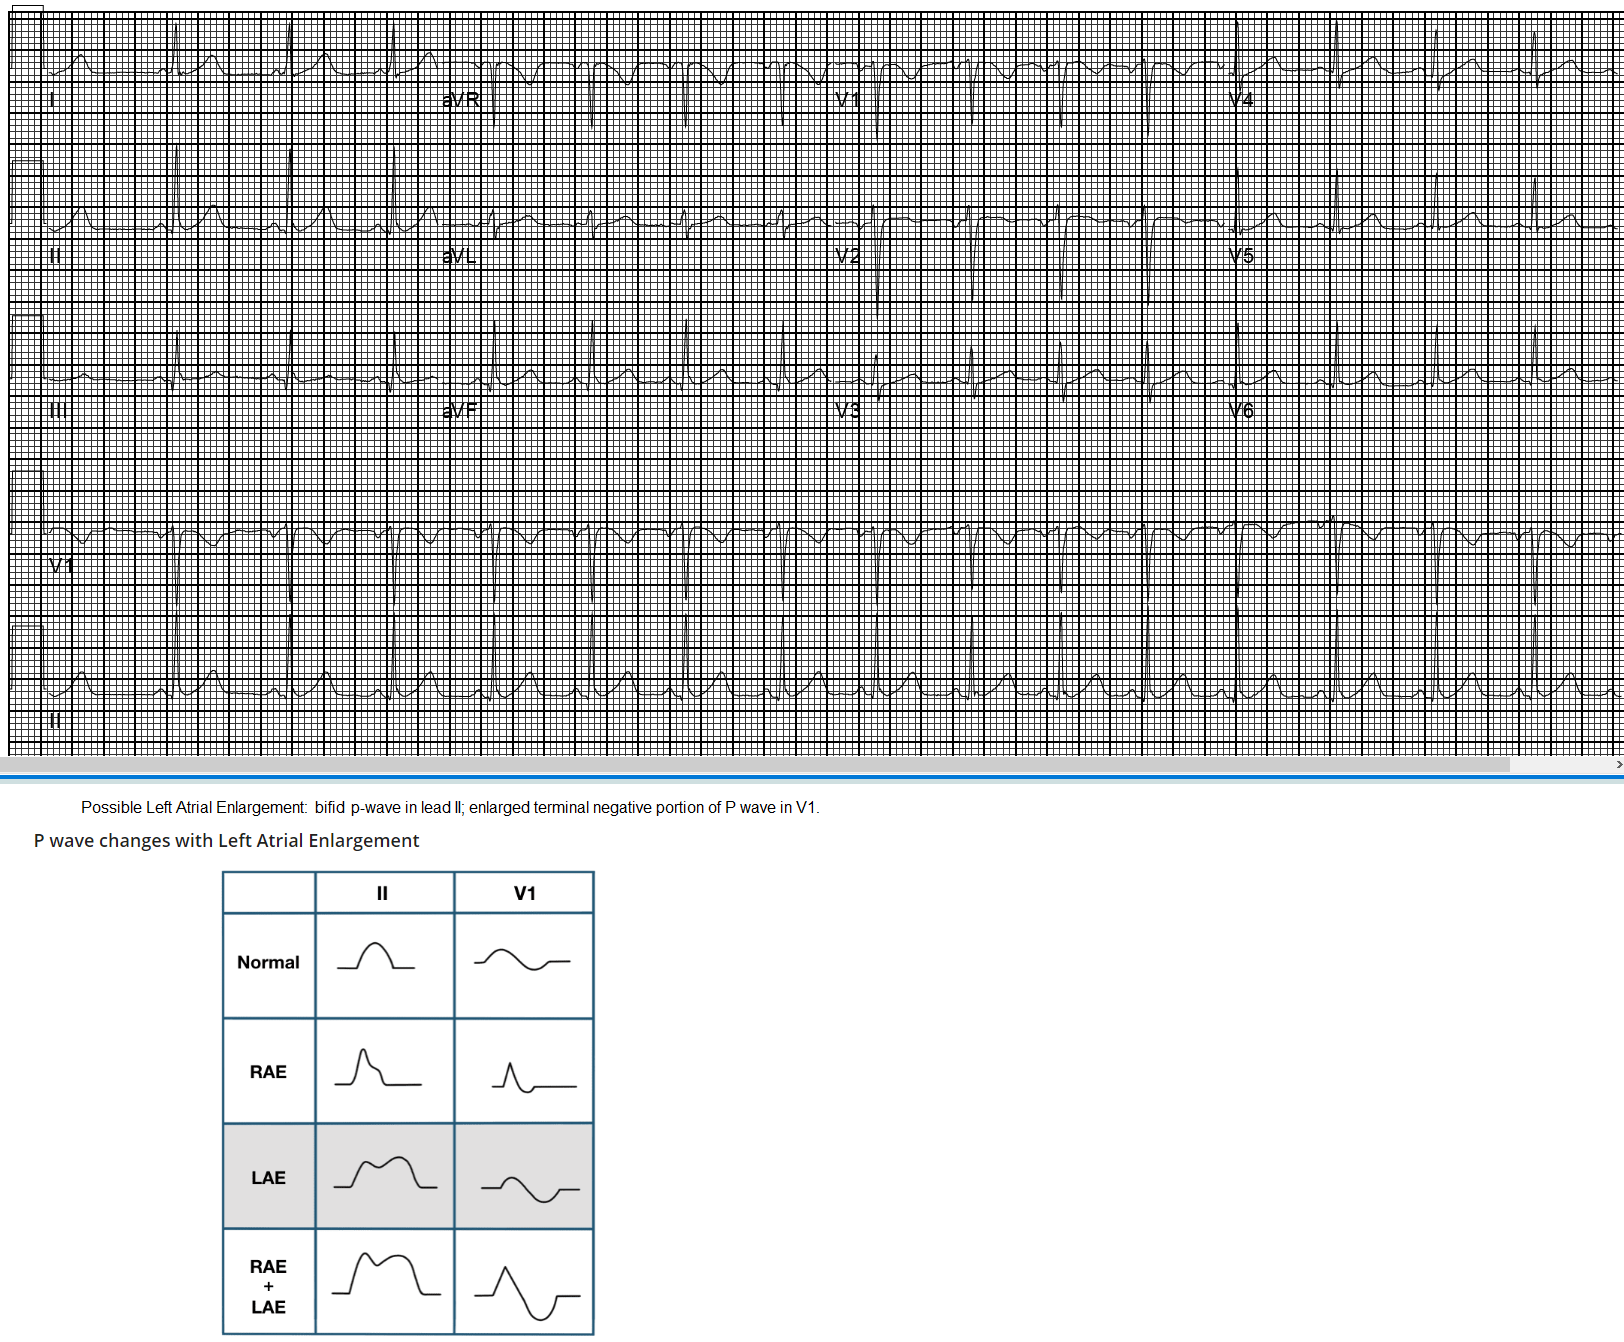
Causes of left atrial hypertrophy
In isolation:
Classically seen with mitral stenosis
In association with left ventricular hypertrophy:
Systemic hypertension
Aortic stenosis
Mitral incompetence
Hypertrophic cardiomyopathy
PAUSES
The events following a PVC are of interest. Usually a PVC is followed by a complete compensatory pause because the sinus node timing is not interrupted; one sinus P wave isn't able to reach the ventricles [i.e., blocked at AV node--mine] because they are still refractory from the PVC; the following sinus impulse occurs on time based on the sinus rate. In contrast, premature atrial contractions (PACs) are usually followed by an incomplete pause because the PAC usually enters the sinus node & resets its timing; this enables the following sinus P wave to appear earlier than expected. These concepts are illustrated below.
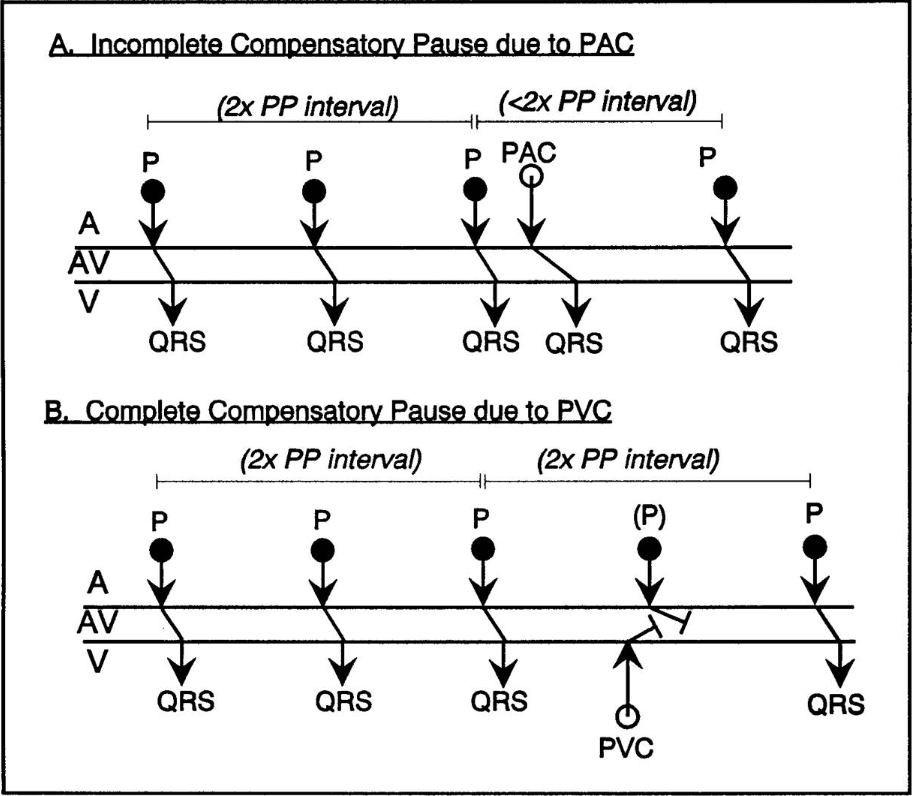
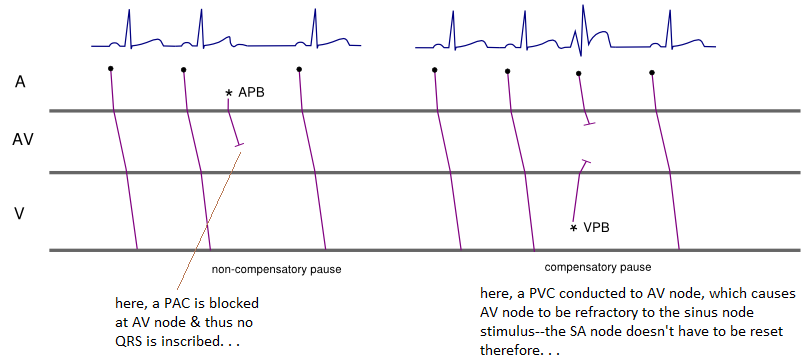
Source: https://ecg.utah.edu/lesson/5-3
To summarize, a PAC is characterized by:
If a PAC occurs when the AV node has not yet recovered from the refractory period, the PAC will fail to conduct to the ventricles & there will not be a QRS complex afterwards. This is seen on the ECG when a premature, ectopic P wave occurs & then is not followed by a QRS complex. When this occurs in a pattern of bigeminy, the interpreter may be fooled into thinking that sinus bradycardia is present, since every other beat is a non-conducted PAC & the QRS rate is quite slow.

*************
Missing QRS
ECG of missing QRS due to transient fascicular block
Proximal LAD Occlusion
A New ECG Sign of Proximal LAD Occlusion.
Instead of the signature ST-segment elevation, the ST segment showed a 1- to 3-mm upsloping ST-segment depression at the J point in leads V1 to V6 that continued into tall, positive symmetrical T waves. The QRS complexes were usually not widened or were only slightly widened, & in some there was a loss of precordial R-wave progression. In most pts there was a 1- to 2-mm ST-elevation in lead aVR.
Source: deWinter. A New ECG Sign of Proximal LAD Occlusion.. N Engl J Med 2008; 359:2071-2073
A 50-year-old male chronic smoker & diabetic presented to the ED with complaints of retrosternal chest pain for 3 hours duration. He did not give any history of angina or dyspnea on exertion in the past. On exam, his pulse rate was 75 per min, his BP was 130/80 mmHg. Cardiac & chest auscultation were within normal limits. Troponin I was elevated. Echocardiography showed lateral wall hypokinesia with an EF of 45%-50% (Video 1). An ECG was performed, which showed J point depression, with downsloping ST-segment depression in leads V2-V4, prominent upright T waves originating below the isoelectric line. Leads V5-V6 showed downsloping ST-segment depression, & leads II, III, aVF showed T wave inversion (Figure 1). The leads V7-V9 did not show ST-segment elevation. This ECG pattern appeared to be a variant of the ECG pattern described by de Winter et al, in which there is J point depression & upsloping ST-segment depression with prominent T wave, which is typically described in occlusion of the left anterior descending artery (LAD). The pt was advised to undergo an immediate coronary angiography. However, he was not willing to undergo any invasive procedure at that time.
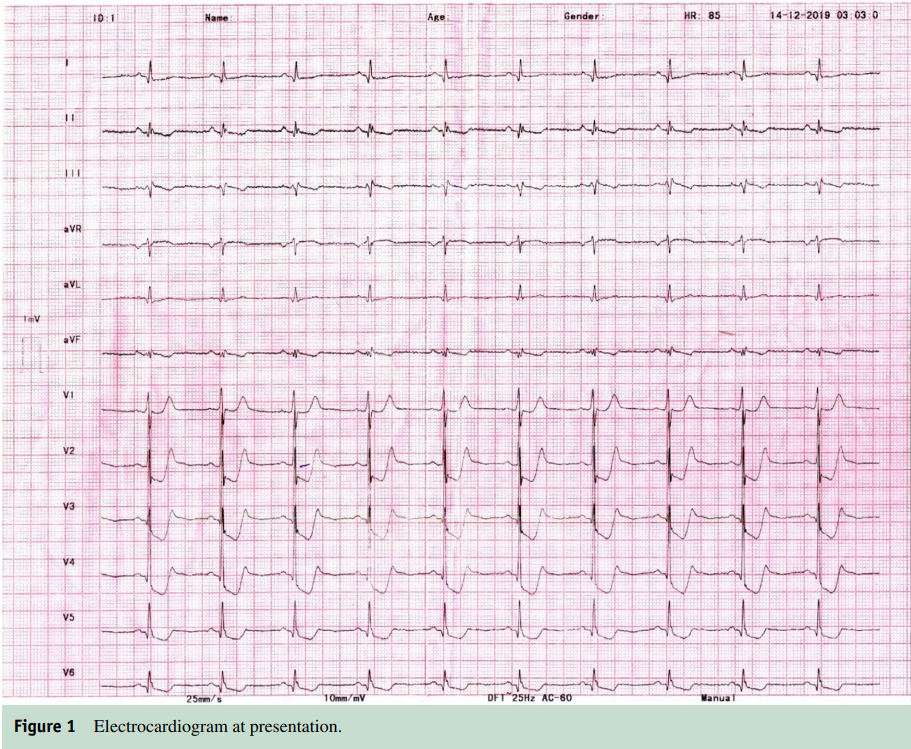
There was no major ST-segment depression or tall R wave in lead V1. Hence, the occlusion of the left circumflex artery was unlikely.
Because pt was unwilling to undergo an immediate coronary angiogram & percutaneous coronary intervention, there was a dilemma regarding administering a thrombolytic agent. In the absence of typical ST-segment elevation, diagnosis of NSTEMI vs. STEMI equivalent becomes tricky. STEMI requires immediate thrombolysis, whereas, in NSTEMI, it is not indicated. Electrocardiography changes in V2-V4 suggested LAD occlusion, but the absence of anteroseptal hypokinesia in echocardiography was not compatible with this.
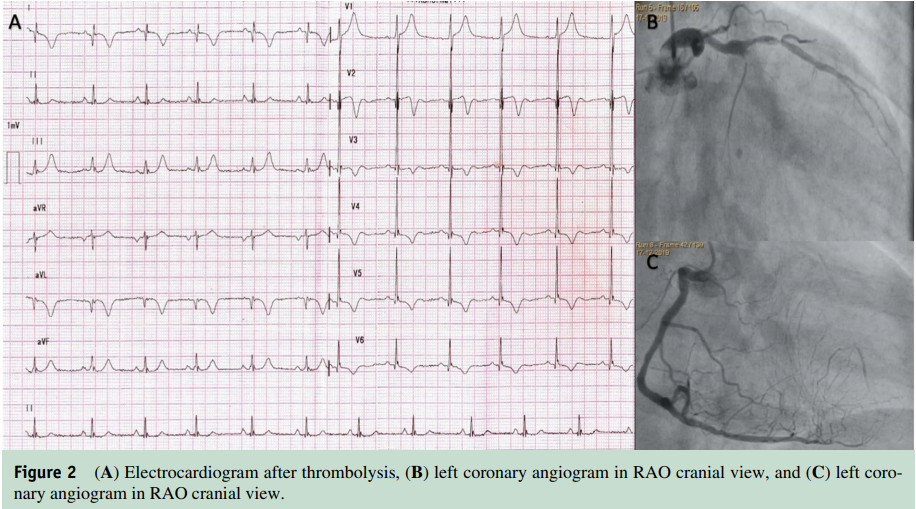
Because the patient had ongoing severe chest pain & had presented 3 hours after the onset of the pain, we administered tenecteplase giving him the benefit of the doubt. 60 minutes after administration of thrombolytic therapy, his chest pain completely subsided. ECG showed development of biphasic T waves in leads V2-V4, suggestive of Wellen’s type A pattern & resolution of T inversion in inferior leads (Figure 2). Development of T wave inversion in leads V2- V4 indicated reperfusion of an occluded artery. 2 days later, a coronary angiogram showed chronic total occlusion of LAD with extensive collateralization from the right coronary artery. The first diagonal branch was large & showed around 80%-90% stenosis with haziness in the lumen, suggestive of a thrombotic lesion. Hence, the diagonal artery was the culprit lesion. The pt was advised to undergo coronary revascularization. However, he preferred to remain on medical therapy.
The probable mechanism of this peculiar ECG pattern was a fusion of subendocardial ischemia in the anterior wall & early transmural ischemic change in the anterolateral wall. The chronically occluded LAD territory was extensively collateralized from the right coronary artery. Probable loss of some collateral supply from diagonal branch to the anterior and apical inferior walls led to subendocardial ischemia, which produced the ST-segment depression & T inversion in inferior leads. Transmural ischemia in the lateral wall produced the tall positive T waves. In our case a large diagonal artery occlusion with pre-existing LAD chronic total occlusion resulted in this unique de Winter-like ECG pattern. In the presence of such ECG changes, reperfusion therapy should be administered promptly irrespective of the location of regional wall motion abnormality, either thrombolysis or primary PCI, depending on the availability of expertise in the locality.
Source: Ahmed A, et al. Perplexing Electrocardiogram in a 50-Year-Old Male with Chest Pain. The American Journal of Medicine Volume 135, Issue 1, January 2022, Pages e4-e6.
MI
Although type 1 MI is characterized by coronary atherothrombosis resulting in acute interruption of coronary blood flow & myocardial necrosis, type 2 MI is characterized by myocardial necrosis caused by a mismatch between myocardial O2 supply & demand. Pts with heart failure have a higher prevalence of coronary artery disease & a high burden of associated comorbidities, which may predispose them to an increased risk of myocardial oxygen demand-supply mismatch. In contemporary clinical practice, type 2 MI is more common than type 1 MI & is similarly associated with poor outcomes.
xxxxx
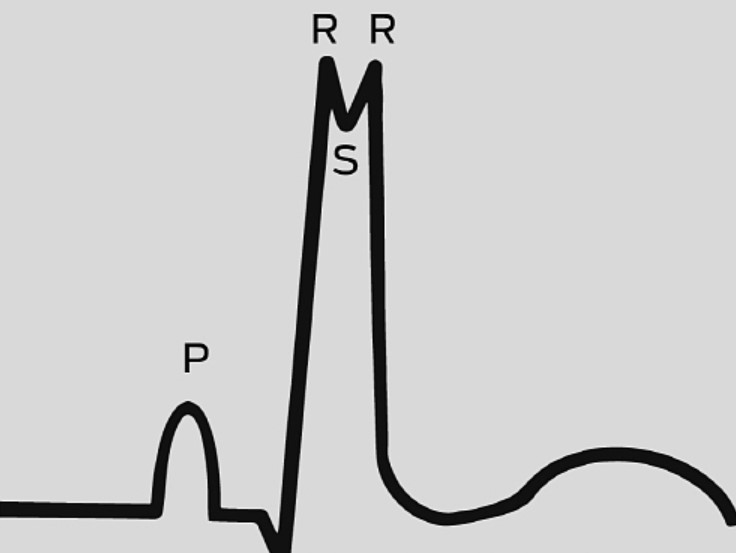
The name Crochetage sign comes from the notch atop the R-wave.
Under normal physiologic conditions the right atrial pressure is markedly lower than the left. The difference allows for the passage of blood from the left atrium to the right, resulting in a left-to-right shunt. Generally pts with an ASD will have this left-to-right shunt.
When an atrial septal defect is present, there is a hole in the septum that divides the right & left atria, the size of which corresponds to the severity of the shunt. This allows oxygen-rich blood to flow retrograde from the left atrium to the right, mixing with deoxygenated blood & increasing the total amount of blood flowing toward the lungs. Large ASDs can thus produce volume overload in the lungs, taxing the heart—this is one reason why pulmonary HTN can manifest in these pts. Small defects seldom create a concern. Some smaller defects close during the first year of life, others during early childhood.
Crochetage Pattern
A Crochetage pattern occurs in the R-wave of the inferior limb leads. The diagnostic presentation will reveal the R-wave prime pattern, which is a 2nd positive deflection of the QRS complex. The R-wave is 1st first positive deflection after the P-wave. Additional positive deflections of the QRS complex extending beyond the baseline & taller than the initial R-wave are defined as an R-wave prime or RSR prime pattern.
Incomplete RBBB have been known as correlating markers for atrial septal defects for > 60 yrs, but a Crochetage sign has some variability & does not depend completely on the presence of an incomplete right bundle branch block for diagnosis. The presence of the RSR pattern in even one lead can provide beneficial information for Dx of an ASD. True positive outcomes of this sign are extraordinarily increased when correlated with an incomplete right bundle branch in all 3 inferior limb leads.
The electrical axis expeditiously conveys electrical transmissions that occur consecutively as the ventricles depolarize. When the ventricles are activated, impulse conduction initially occurs on either side of the septum, down the right & left bundle branches. Therefore, septal depolarization naturally occurs from left to right. Depolarization occurs when the membrane potential is reduced to a less-negative value.
Shapes of a QRS complex may appear different in each limb lead because each lead has a different vantage point to the specific order of depolarization. Since the normal QRS complex identifies synchronous depolarization of the ventricles, this is where abnormalities will be identified. When the Crochetage sign is accompanied by an incomplete right bundle branch block and noted in leads, II, III, & aVF, the specificity is near 90%. The name Crochetage sign came from the appearance of the distinct notch at the top of the R-wave that looks like the workings of a crochet needle.
Some additional ECG findings that accompany the incomplete right bundle branch block are a posterior hemifascicular block and a right atrial enlargement.6 The presence of an RSR in lead V1 increases the specificity to ~ 80% likelihood of the presence of an ASD. Inversion of the P-waves can occur, suggesting sinoatrial node deficiency. T-wave inversion in leads V3R, V4R, & V5R also increases the specificity of diagnosis of atrial septal defect. After surgical repair around 35% of pts will lose the Crochetage sign on their ECG; however, the RBBB pattern may still be present.
In pts with atrial septal defects, ECG abnormalities correlate with shunt severity & are independent of the right bundle branch pattern. The distinct presentation of the Crochetage sign shows a delay in the depolarization of the RV. When a RBBB is noted, this means the RV depolarized last. The incomplete RBBB is attributed to prolonged depolarization of the hypertrophied outflow tract of the RV, potentially exacerbated by volume overload in the RV.
Source:
Lane K, Layell R. Crochetage Sign. EMS World. February 2022; ISSN 51, Index 2, pp. 38-41