pandasDataframeFilterWithMultipleConditions.pdf
mergedAfter.py filterToSheet.py
Configure path to install SQLAlchemy here
python websites here
In Windows: open Command Prompt, type in: python --version
Path to python folder in Lenovo: C:\Users\norml\source\repos\PythonApplication1\PythonApplication1
Current Working Directory: C:\Users\norml\source\repos\PythonApplication2\PythonApplication2
import os
cwd = os.getcwd()
print(cwd)
from google.colab import files
uploaded = files.upload()
import pandas as pd
# After uploading, the filename will be 'ai_1.xlsx'
df = pd.read_excel('ai_1.xlsx')
print(df)
import pandas as pd
# Example DataFrame
df = pd.DataFrame({'Column1': [1, 2], 'Column2': [3, 4]})
# Save DataFrame to CSV
df.to_csv('output.csv', index=False)
from google.colab import files

# Download the file
files.download('output.csv')
C:\Users\chris>mkdir pyver
C:\Users\chris>mkdir pyproj
C:\Users\chris>dir

C:\Users\chris>cd pyproj
C:\Users\chris\pyproj>c:\Users\chris\pyver\py310\python -m venv my_env 'note: "my_env" is made up
C:\Users\chris\pyproj>dir
C:\Users\chris\pyproj>tree my_env 'note: "my_env" is made up
C:\Users\chris\pyproj>my_env\Scripts\activate 'to activate python
(my env) C:\Users\chris\pyproj>python 'to open python
(my env) C:\Users\chris\pyproj>pip install pandas
(my env) C:\Users\chris\pyproj>pip install XLSXwriter
(my env) C:\Users\chris\pyproj>pip install SQLAlchemy
(my env) C:\Users\chris\pyproj>pip install XLRD
(my env) C:\Users\chris\pyproj>pip install openPYXL
(my env) C:\Users\chris\pyproj>pip install jupyter
(my env) C:\Users\chris\pyproj>jupyter notebook
>>>exit() 'to exit or quit()
Source: https://www.youtube.com/watch?v=28eLP22SMTA&t=441s
(my env) C:\Users\chris\pyproj>python mergedAfter.py 'place "mergedAfter.py" file inside the pyproj folder

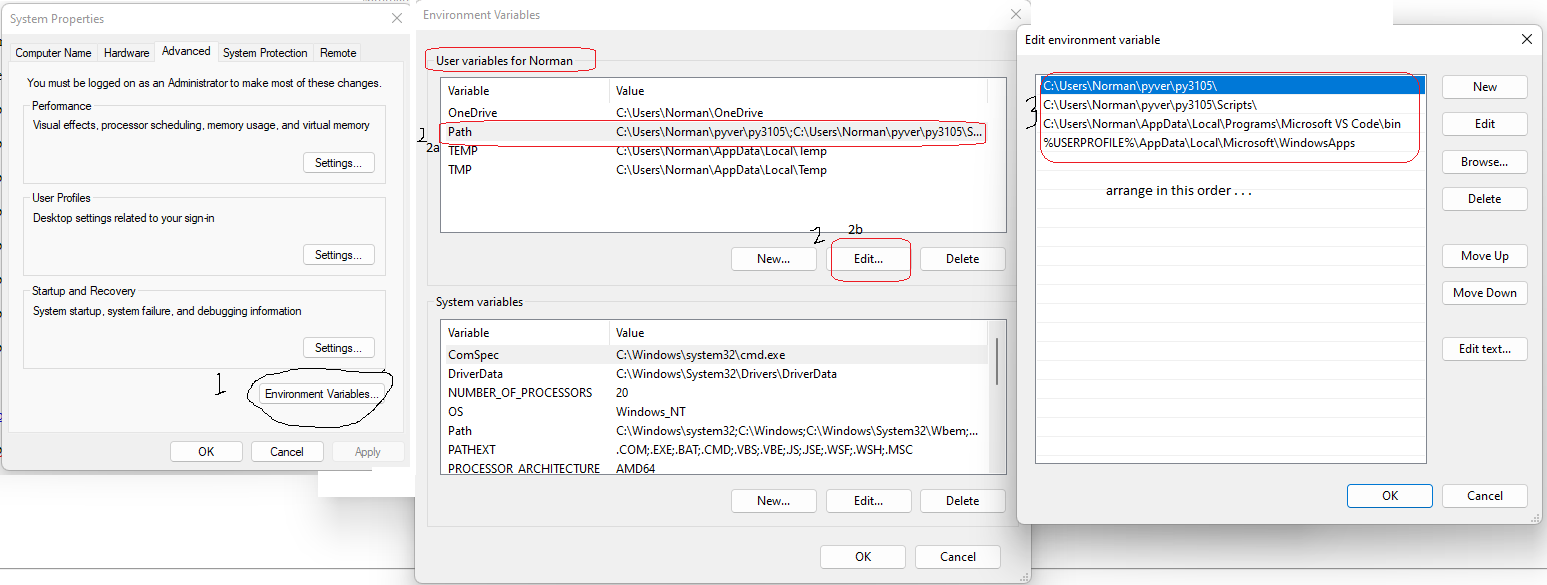
PATH -- how to edit environment variables
C:\Users\Norman\pyver\py3105\
C:\Users\Norman\pyver\py3105\Scripts\
Use Visual Studio Code and your virtual environment video is here by me; selecting python interpreter for VS Code is here by me, and another video
Install Python on Windows
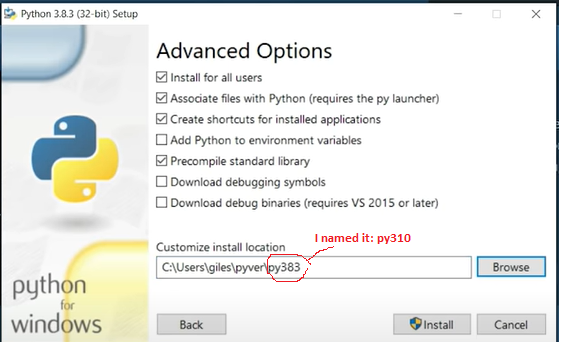
Go to python.org & download latest version--along with newest updates!; select 'Add Python to PATH'
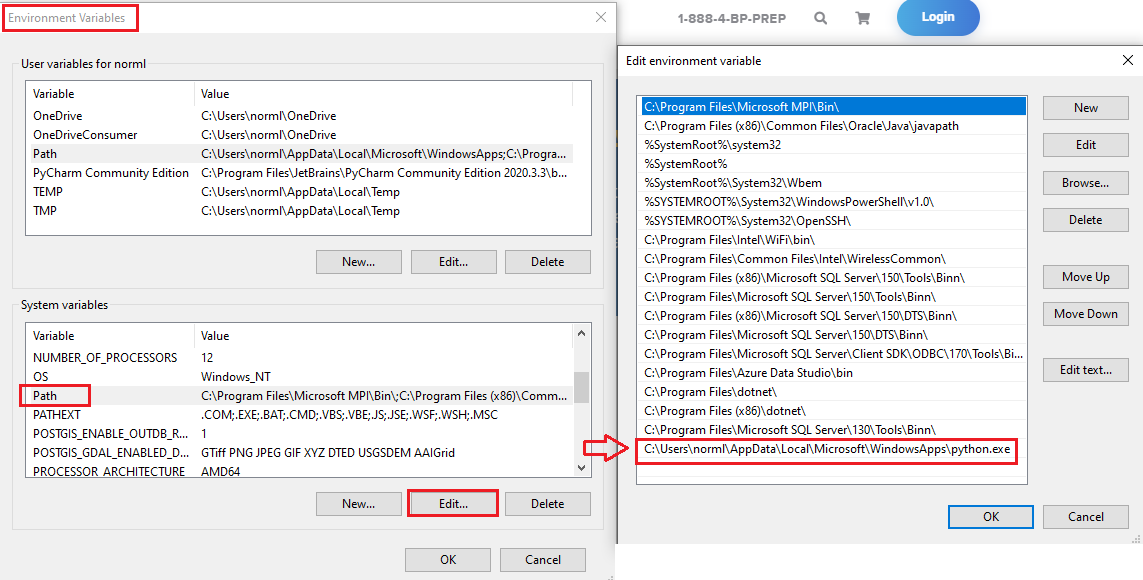
Confirm path:
Using Microsoft Visual Studio to Import Python Libraries
where python
Go to CMD terminal &: 'pip3 install pandas'
Install: openpyxl, SQLAlchemy, XLXSWriter, xlrd, xlwings
Select Python interpreter here
Install python Virtual Environment on Mac: my video is here
python3 -m venv NormDemoEnv >>>>> source /Users/normanlee/Desktop/10-1-22/NormDemoEnv/bin/activate >>>>>pip3 install pandas >>>>>pip3 install openpyxl
pip install xlrd
import pandas as pd

df = pd.read_excel('sample.xlsx')

print(df)
import pandas as pd
df = pd.read_csv('pokemon.csv')
print(df.head(3))
Absolute Path for Pandas
import pandas as pd
excel_file_path = 'C://Users//norml//Pictures//Python//OccHlthStuff//training_status.xlsx'
df = pd.read_excel(excel_file_path)
print(df)
or. . .
import pandas as pd
df = pd.read_excel (r'C:\Users\norml\Pictures\Python\OccHlthStuff\A1_11.15.xlsx')
#place "r" before the path string to address special character, such as '\'. Don't forget to put the file name at the end of the path + '.xlsx'
print (df)
or. . .
import pandas as pd
pathOfFile = 'C://Users//norml//Pictures//Python//OccHlthStuff//A1_11.15' #note the double backslashes
df = pd.read_excel (pathOfFile + '.xlsx')
print (df)

Display Selected Columns from Dataframe
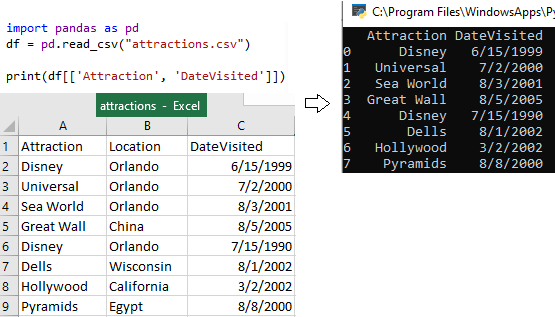
import pandas as pd
df = pd.read_csv("attractions.csv")
print(df[['Attraction', 'DateVisited']])
import pandas as pd
import numpy as np
initial_wb = 'A1_11.7.21a.xlsx'
info_wb = 'B1_11.7.21.xlsx'
df_initial = pd.read_excel(initial_wb)
df_info = pd.read_excel(info_wb)
outer_join = pd.merge(df_initial,
df_info,
on ='IDs',
how ='outer')
outer_join.to_csv('outerJoined.csv',index=False) ' change to True if you want row index #s
Merging Flu Data site here
For Mac OS, see below:
import pandas as pd
import numpy as np
initial_wb = 'A1_11.7.21.xlsx'
info_wb = 'B1_11.7.21.xlsx'
df_initial = pd.read_excel(initial_wb, engine='openpyxl')
df_info = pd.read_excel(info_wb, engine='openpyxl')
outer_join = pd.merge(df_initial, df_info,
on ='IDs',
how = 'outer')
outer_join.to_csv('outerJoined.csv', index=True)
Merge Workbooks By Using Multiple Conditions (SQL) using Pandas
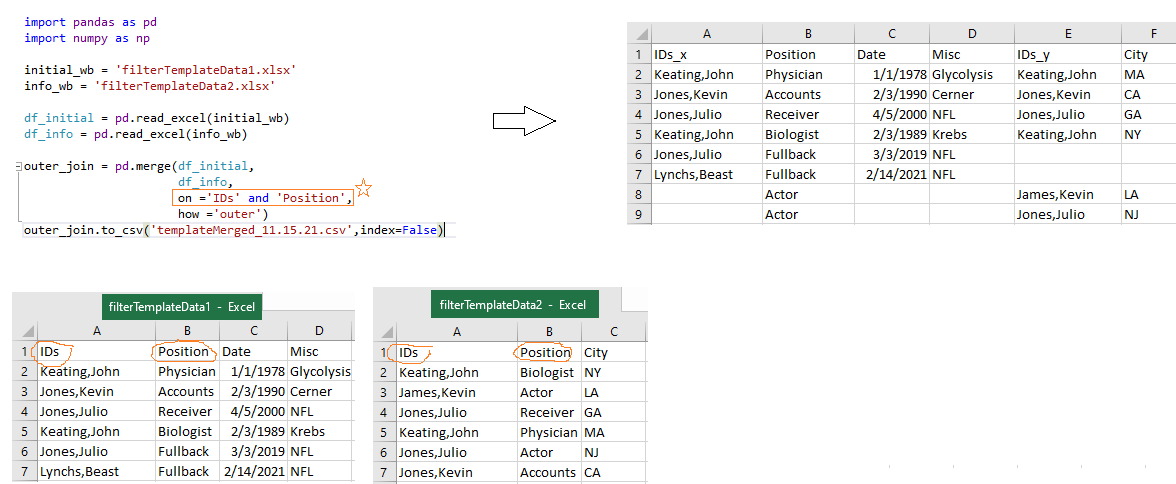
import pandas as pd
import numpy as np
initial_wb = 'filterTemplateData1.xlsx'
info_wb = 'filterTemplateData2.xlsx'
df_initial = pd.read_excel(initial_wb, engine='openpyxl')
df_info = pd.read_excel(info_wb, engine='openpyxl')
outer_join = pd.merge(df_initial,
df_info,
on ='IDs' and 'Position', #note the two conditions: IDs & Position
how ='outer')
outer_join.to_csv('templateMerged_11.15.21.csv',index=False)
Files: filterTemplateData1.xlsx and filterTemplateData2.xlsx
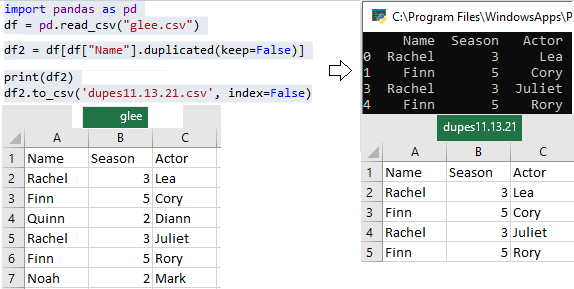
Find Duplicates
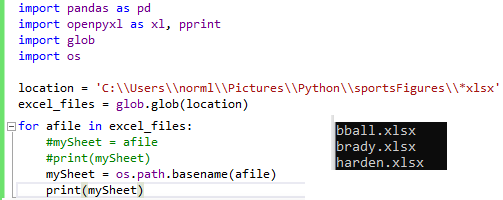
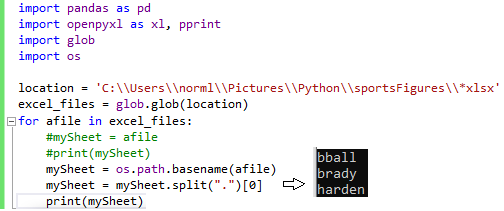
Print Names & File Path of All Sheets in a Folder

print just the base names . . . use 'os'
remove '.xlsx' from filename . . . using "split" method
Filter
Using loc

import pandas as pd
#read the excel data
xlsx_source = 'sportingGoods.xlsx'
df1 = pd.read_excel(xlsx_source, sheet_name=0, header=0)
print(df1.loc[df1['Price'] == 888]) # don't put quotes around numbers
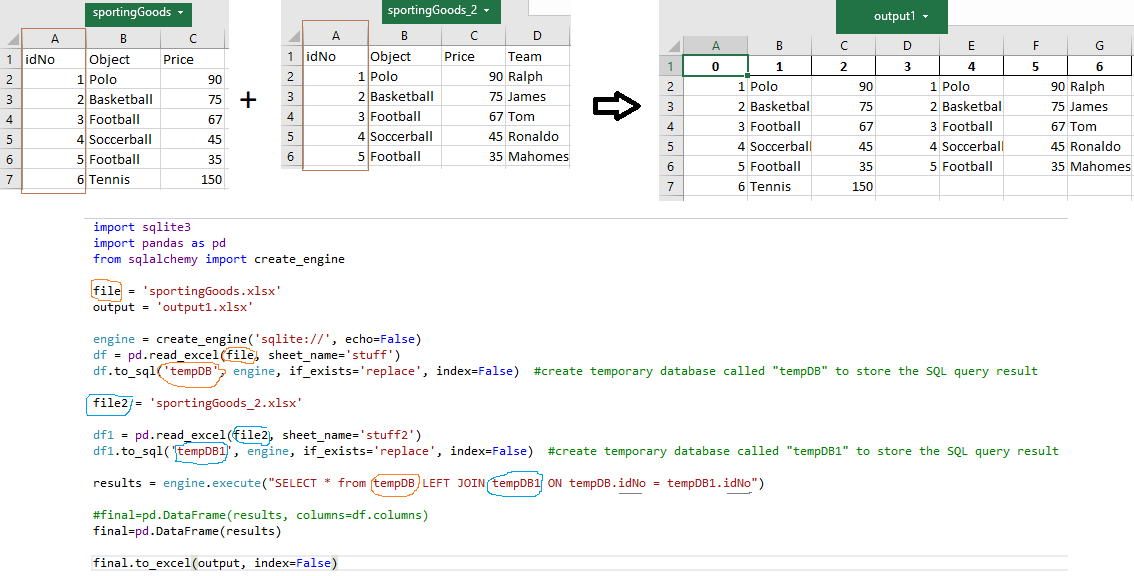
Left Outer Join on ID number [merge matching rows into one row]

import pandas as pd
import openpyxl as xl, pprint
import glob
import os
#read the excel data
xlsx_source = 'sportingGoods.xlsx'
df1 = pd.read_excel(xlsx_source, sheet_name=0, header=0)
#df1.head(3)
#read the excel data
xlsx_source = 'fruits.xlsx'
df2 = pd.read_excel(xlsx_source, sheet_name=0, header=0)
#df2.head(3)
df_outer = pd.merge(df1, df2, on='idNo', how='outer')
print(df_outer)
Another way . . .
import sqlite3
import pandas as pd
from sqlalchemy import create_engine
file = 'sportingGoods.xlsx'
output = 'output1.xlsx'
engine = create_engine('sqlite://', echo=False)
df = pd.read_excel(file, sheet_name='stuff')
df.to_sql('tempDB', engine, if_exists='replace', index=False) #create temporary database called "tempDB" to store the SQL query result
file2 = 'sportingGoods_2.xlsx'
df1 = pd.read_excel(file2, sheet_name='stuff2')
df1.to_sql('tempDB1', engine, if_exists='replace', index=False) #create temporary database called "tempDB1" to store the SQL query result
results = engine.execute("SELECT * from tempDB LEFT JOIN tempDB1 ON tempDB.idNo = tempDB1.idNo")
#final=pd.DataFrame(results, columns=df.columns)
final=pd.DataFrame(results)
final.to_excel(output, index=False)
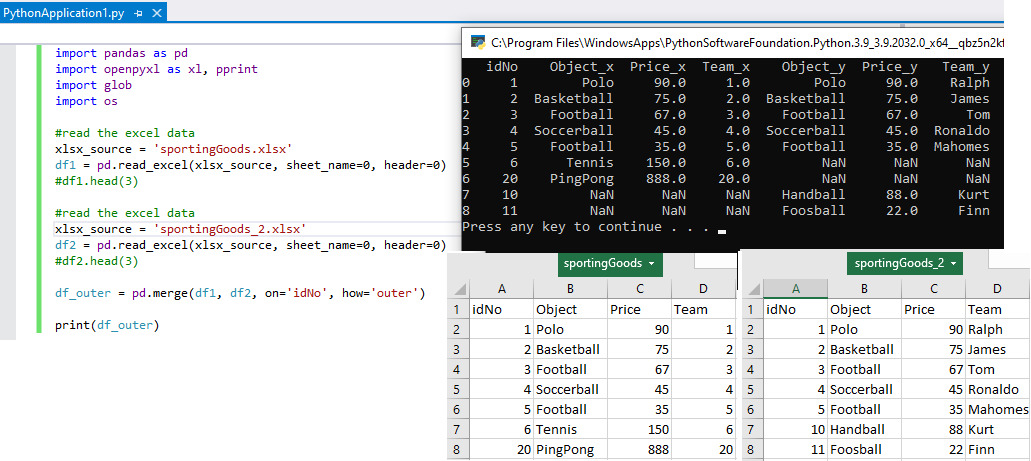
FULL OUTER JOIN
import pandas as pd
import openpyxl as xl, pprint
import glob
import os
#read the excel data
xlsx_source = 'sportingGoods.xlsx'
df1 = pd.read_excel(xlsx_source, sheet_name=0, header=0)
#df1.head(3)
#read the excel data
xlsx_source = 'sportingGoods_2.xlsx'
df2 = pd.read_excel(xlsx_source, sheet_name=0, header=0)
#df2.head(3)
df_outer = pd.merge(df1, df2, on='idNo', how='outer')
print(df_outer)
Another way:
import pandas as pd
import openpyxl as xl, pprint
import glob
import os
#read the excel data
xlsx_source = 'sportingGoods.xlsx'
df1 = pd.read_excel(xlsx_source, sheet_name=0, header=0)
#df1.head(3)
#read the excel data
xlsx_source2 = 'sportingGoods_2.xlsx'
df2 = pd.read_excel(xlsx_source2, sheet_name=0, header=0)
#read the excel data
xlsx_source3 = 'sportingGoods_3.xlsx'
df3 = pd.read_excel(xlsx_source3, sheet_name=0, header=0)
#df_outer = df1.join(df2, how='outer').join(df3, how='outer')
da = df1.set_index(['idNo']).rename_axis(['id'])
db = df2.set_index(['idNo']).rename_axis(['id'])
dc = df3.set_index(['idNo']).rename_axis(['id'])
df_outer = da.join(db, on='id', how='outer', lsuffix='_left', rsuffix='_right')
print(df_outer)
df_outer.to_csv('file_name.csv',index=False)
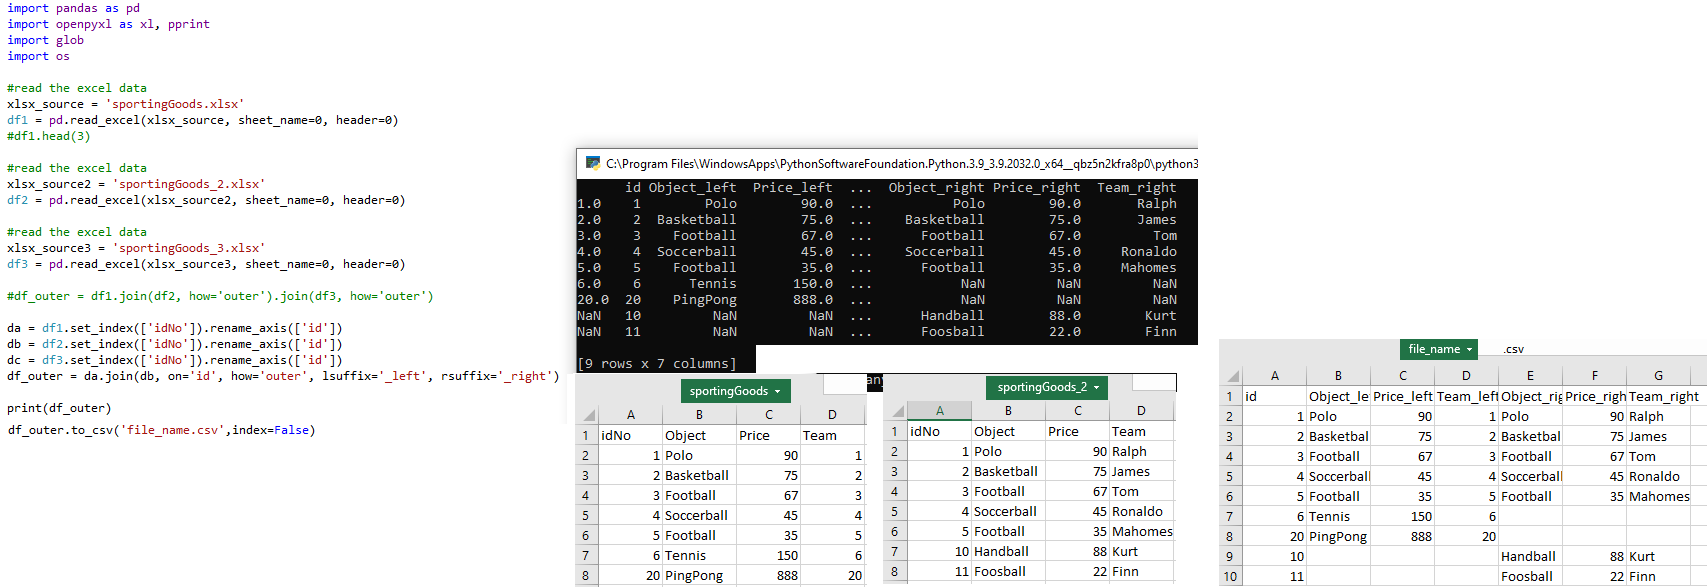
Full Outer Join: THREE tables
import pandas as pd
from functools import reduce
#read the excel data
xlsx_source = 'sportingGoods.xlsx'
df1 = pd.read_excel(xlsx_source, sheet_name=0, header=0)
#read the excel data
xlsx_source2 = 'sportingGoods_2.xlsx'
df2 = pd.read_excel(xlsx_source2, sheet_name=0, header=0)
#read the excel data
xlsx_source3 = 'sportingGoods_3.xlsx'
df3 = pd.read_excel(xlsx_source3, sheet_name=0, header=0)
# compile the list of dataframes you want to merge
data_frames = [df1, df2, df3]
df_merged = reduce(lambda left,right: pd.merge(left,right,on=['idNo'],
how='outer'), data_frames)
df_merged.to_csv('file_name.csv',index=False) #place outer join results into new .csv file
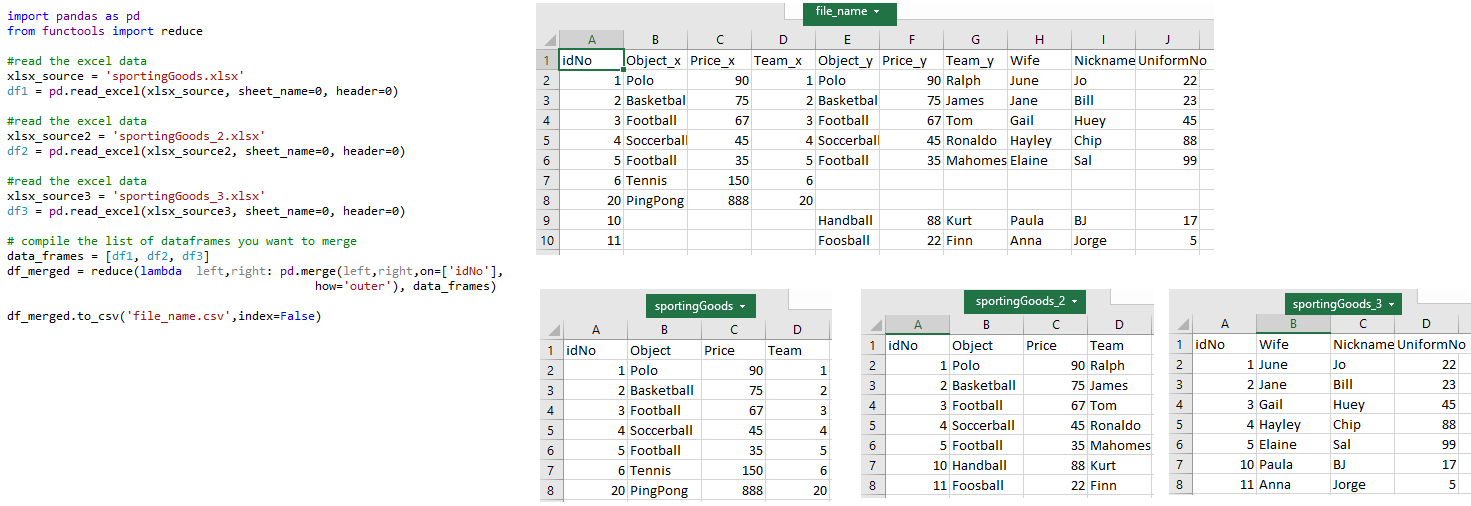
Files: sportingGoods.xlsx , sportingGoods_2.xlsx , sportingGoods_3.xlsx
OUTER JOIN FLU DATA
import pandas as pd
import numpy as np
initial_wb = 'A1_11.7.21a.xlsx'
info_wb = 'B1_11.7.21.xlsx'
df_initial = pd.read_excel(initial_wb)
df_info = pd.read_excel(info_wb)
outer_join = pd.merge(df_initial,
df_info,
on ='IDs',
how ='outer')
outer_join.to_csv('outerJoined.csv',index=True)
INNER JOIN: Intersection
import pandas as pd
import numpy as np
initial_wb = 'A1.xlsx'
info_wb = 'B1.xlsx'
df_initial = pd.read_excel(initial_wb)
df_info = pd.read_excel(info_wb)
inner_join = pd.merge(df_initial,
df_info,
on ='IDs',
how ='inner')
inner_join.to_csv('innerJoined.csv',index=True)
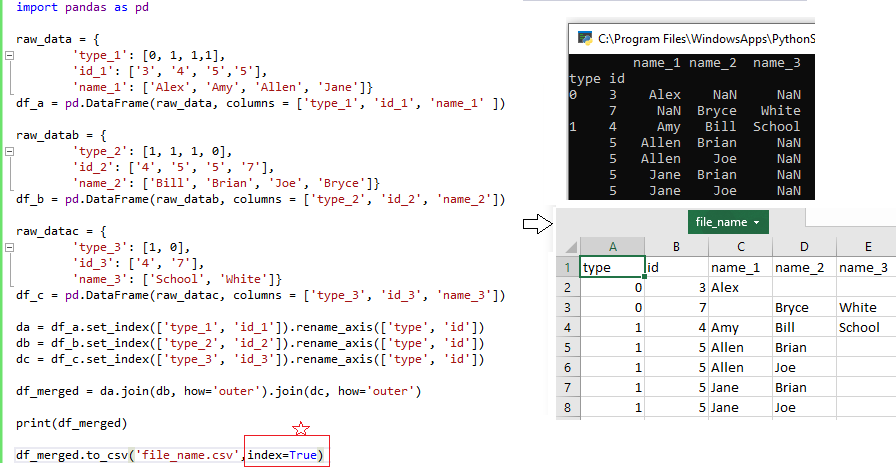
Merge a Multi-Indexed Group of DataFrames: eg, two columns serving as indexes
import pandas as pd
raw_data = {
'type_1': [0, 1, 1,1],
'id_1': ['3', '4', '5','5'],
'name_1': ['Alex', 'Amy', 'Allen', 'Jane']}
df_a = pd.DataFrame(raw_data, columns = ['type_1', 'id_1', 'name_1' ])
raw_datab = {
'type_2': [1, 1, 1, 0],
'id_2': ['4', '5', '5', '7'],
'name_2': ['Bill', 'Brian', 'Joe', 'Bryce']}
df_b = pd.DataFrame(raw_datab, columns = ['type_2', 'id_2', 'name_2'])
raw_datac = {
'type_3': [1, 0],
'id_3': ['4', '7'],
'name_3': ['School', 'White']}
df_c = pd.DataFrame(raw_datac, columns = ['type_3', 'id_3', 'name_3'])
da = df_a.set_index(['type_1', 'id_1']).rename_axis(['type', 'id'])
db = df_b.set_index(['type_2', 'id_2']).rename_axis(['type', 'id'])
dc = df_c.set_index(['type_3', 'id_3']).rename_axis(['type', 'id'])
df_merged = da.join(db, how='outer').join(dc, how='outer')
print(df_merged)
df_merged.to_csv('file_name.csv',index=True)
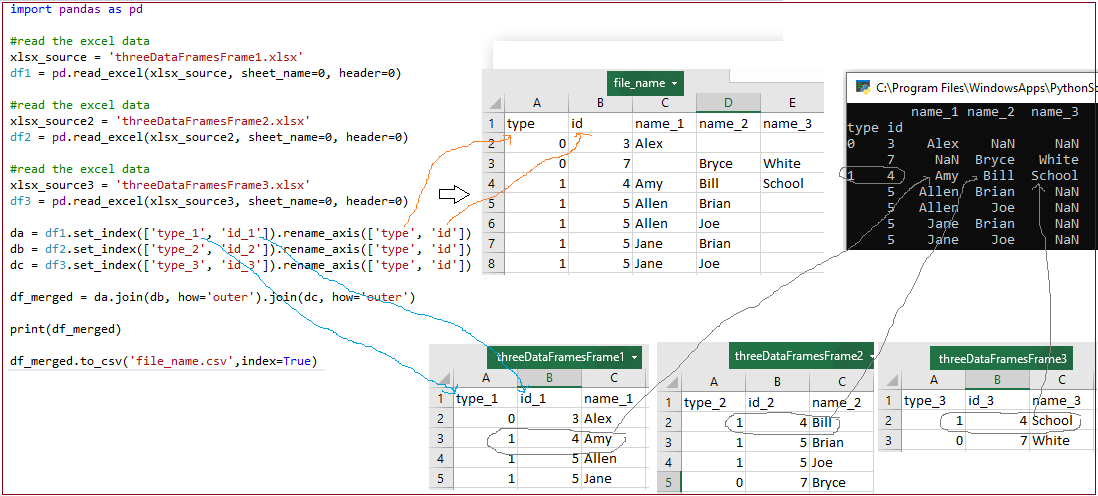
Merge a Multi-Indexed Group of Excel Files
import pandas as pd
#read the excel data
xlsx_source = 'threeDataFramesFrame1.xlsx'
df1 = pd.read_excel(xlsx_source, sheet_name=0, header=0)
#read the excel data
xlsx_source2 = 'threeDataFramesFrame2.xlsx'
df2 = pd.read_excel(xlsx_source2, sheet_name=0, header=0)
#read the excel data
xlsx_source3 = 'threeDataFramesFrame3.xlsx'
df3 = pd.read_excel(xlsx_source3, sheet_name=0, header=0) # header of '0' means the column headers are in the 1st row
da = df1.set_index(['type_1', 'id_1']).rename_axis(['type', 'id'])
db = df2.set_index(['type_2', 'id_2']).rename_axis(['type', 'id'])
dc = df3.set_index(['type_3', 'id_3']).rename_axis(['type', 'id'])
df_merged = da.join(db, how='outer').join(dc, how='outer')
print(df_merged)
df_merged.to_csv('file_name.csv',index=True) #keep 'index' to 'True' to display index #s in Excel sheet
VBA

import xlwings as xw
wk = xw.Book('testXLwings1.xlsx')
sheet = wk.sheets[0]
toy = sheet.range('A1:B4').value
print(toy)
Pandas

import pandas as pd
df = pd.read_excel('testXLwings1bb.xlsx' , sheet_name='query')
results = df.loc[df['UniformNo'] > 20]
results.to_excel('testXLwings1d.xlsx', sheet_name='results1')
Multiple conditions. . .
import pandas as pd
df = pd.read_excel('testXLwings1bb.xlsx' , sheet_name='query')
results = df.loc[(df['UniformNo'] > 20) & (df['Name'] == 'James')]
results.to_excel('testXLwings1d.xlsx', sheet_name='results1')
Note:
df2 = df.loc[((df['a'] > 1) & (df['b'] > 0)) | ((df['a'] < 1) & (df['c'] == 100))]
Count Rows
import pandas as pd
df = pd.read_excel('testXLwings1bb.xlsx' , sheet_name='query')

results = df.loc[(df['UniformNo'] > 20) & (df['Name'] == 'James')]

results.to_excel('testXLwings1d.xlsx', sheet_name='results1')

df1 = pd.read_excel('testXLwings1d.xlsx' , sheet_name='results1')

count_row = df1.shape[0]  # Gives number of rows

print(count_row)

count_row1 = len(df1)

print(count_row1)
Reading material:
Get Values from Rows, Columns Using Dataframe
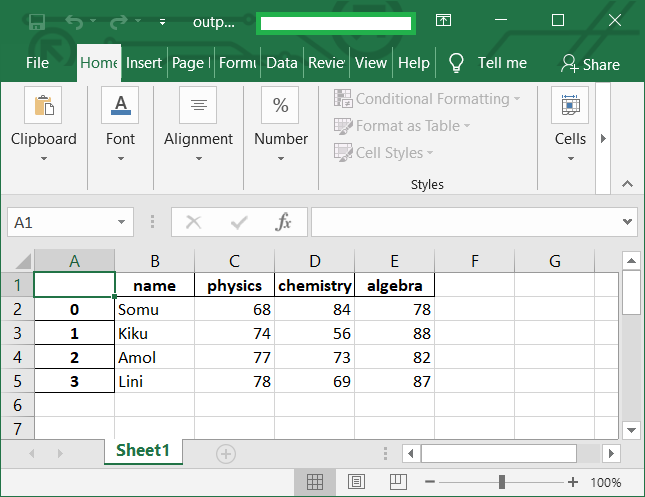
WRITING TO EXCEL
import pandas as pd
# create dataframe
df_marks = pd.DataFrame({'name': ['Somu', 'Kiku', 'Amol', 'Lini'],
'physics': [68, 74, 77, 78],
'chemistry': [84, 56, 73, 69],
'algebra': [78, 88, 82, 87]})
# create excel writer object
writer = pd.ExcelWriter('output.xlsx')
# write dataframe to excel
df_marks.to_excel(writer)
# save the excel
writer.save()
print('DataFrame is written successfully to Excel File.')
Row & Column Count
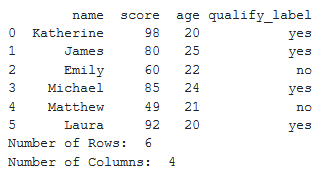
# importing pandas
import pandas as pd
result_data = {'name': ['Katherine', 'James', 'Emily',
'Michael', 'Matthew', 'Laura'],
'score': [98, 80, 60, 85, 49, 92],
'age': [20, 25, 22, 24, 21, 20],
'qualify_label': ['yes', 'yes', 'no',
'yes', 'no', 'yes']}
# creating dataframe
df = pd.DataFrame(result_data, index = None)
# computing number of rows
rows = len(df.axes[0])
# computing number of columns
cols = len(df.axes[1])
print(df)
print("Number of Rows: ", rows)
print("Number of Columns: ", cols)
Insert Textbox
import pandas as pd
df = pd.read_excel('testXLwings1bbb.xlsx' , sheet_name='query1')
results = df.loc[(df['Position'] == 'Pharmacists') & (df['ClinicalorNot'] == 'Clinical')]
results.to_excel('results1.xlsx', sheet_name='Sheet1')
df1 = pd.read_excel('results1.xlsx' , sheet_name='Sheet1')
writer = pd.ExcelWriter('results1.xlsx', engine='xlsxwriter')
df1.to_excel(writer, sheet_name='Sheet1')
workbook = writer.book
worksheet = writer.sheets['Sheet1']
worksheet.insert_textbox(8,10, "Hello World!")
writer.save()
or
import pandas as pd
df = pd.read_excel('testXLwings1bbb.xlsx' , sheet_name='query1')
results = df.loc[(df['Position'] == 'Pharmacists') & (df['ClinicalorNot'] == 'Clinical')]
results.to_excel('results1.xlsx', sheet_name='Sheet1')
df1 = pd.read_excel('results1.xlsx' , sheet_name='Sheet1')
count_row1 = len(df1)
writer = pd.ExcelWriter('results1.xlsx', engine='xlsxwriter')
df1.to_excel(writer, sheet_name='Sheet1')
workbook = writer.book
worksheet = writer.sheets['Sheet1']
worksheet.insert_textbox(0, 44, "4") #this places "4" in column 'AS'
writer.save()
INSERT VALUE INTO CELL RANGE
import pandas as pd #testXLwings1bbb.xlsx is here
df = pd.read_excel('testXLwings1bbb.xlsx' , sheet_name='query1')
results = df.loc[(df['Position'] == 'Pharmacists') & (df['ClinicalorNot'] == 'Clinical')]
results.to_excel('results1.xlsx', sheet_name='Sheet1')
df1 = pd.read_excel('results1.xlsx' , sheet_name='Sheet1')
count_row1 = len(df1) #this is the number of rows in Sheet1 of 'results1.xlsx'
writer = pd.ExcelWriter('results1.xlsx', engine='xlsxwriter') #make sure you've: pip install xlsxwriter
df1.to_excel(writer, sheet_name='Sheet1')
workbook = writer.book #not sure if this line is needed. . .
worksheet = writer.sheets['Sheet1'] #note: the 1st row is index 0
worksheet.write(0, 44, count_row1) #this writes the value of 'count_row1' into cell 'AS1' which is '0,44'
writer.save()

Edit Existing Worksheet
from openpyxl import Workbook, load_workbook
wb = load_workbook('results1.xlsx')
ws = wb.active
print(ws['B2'].value)
ws['B2'].value ="36" #change cell B2 to contain 36
wb.save('results1.xlsx') #save the edits
find 'results1.xlsx' file here
Show all worksheets by name
from openpyxl import Workbook, load_workbook
wb = load_workbook('results1.xlsx')
ws = wb.active
print(wb.sheetnames)
Select existing worksheet & add value to a cell
from openpyxl import Workbook, load_workbook
wb = load_workbook('results1.xlsx')
ws = wb['durant']
ws['B2'].value ="36" #change cell B2 to contain 36 (in sheet named 'durant')
wb.save('results1.xlsx')
Create new worksheet (named 'Test') within an existing Excel file & add '36' to B2 in the new worksheet
import pandas as pd
from openpyxl import Workbook, load_workbook
wb = load_workbook('results1.xlsx')
wb.create_sheet("Test")
ws = wb['Test']
ws['B2'].value ="36" #change cell B2 to contain 36
wb.save('results1.xlsx')
WORKSHEET from XlxsWriter
The worksheet class represents an Excel worksheet. It handles operations such as writing data to cells or formatting worksheet layout.
A worksheet object isn’t instantiated directly. Instead a new worksheet is created by calling the add_worksheet() method from a Workbook() object:
workbook   = xlsxwriter.Workbook('filename.xlsx')  #this creates the workbook object named 'workbook'

worksheet1 = workbook.add_worksheet()
worksheet2 = workbook.add_worksheet()

worksheet1.write('A1', 123)

workbook.close()
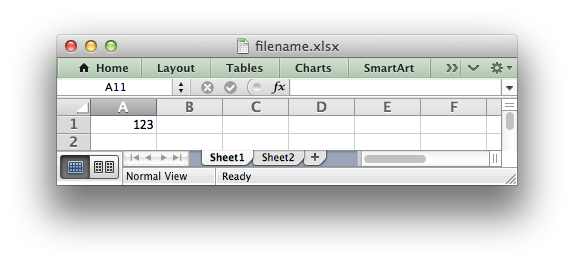
Source: https://xlsxwriter.readthedocs.io/worksheet.html
XlsxWriter can only create new files. It cannot read or modify existing files.
Source: https://xlsxwriter.readthedocs.io/tutorial01.html
Create New Workbook & Insert Headers
from openpyxl import Workbook, load_workbook
wb = Workbook()
ws = wb.active
ws.title = "Data"
ws.append(['LastName', 'FirstName', 'DOB', 'email'])
wb.save('headersNew.xlsx')
Merge Cells
from openpyxl import Workbook, load_workbook
wb = load_workbook('results1.xlsx')
ws = wb.active
ws.merge_cells("A1:D1")
wb.save('results1.xlsx')
Insert Rows
from openpyxl import Workbook, load_workbook
wb = load_workbook('results1.xlsx')
ws = wb.active
ws.insert_rows(7) #this will insert row after row 6
ws.insert_rows(7) #this will insert ANOTHER row after row 6, so two new rows after row 6
wb.save('results1.xlsx')
Insert Columns
from openpyxl import Workbook, load_workbook
wb = load_workbook('results1.xlsx')
ws = wb.active
ws.insert_cols(2) #this will insert a new column at Column B
wb.save('results1.xlsx')
Move Values
from openpyxl import Workbook, load_workbook
wb = load_workbook('results1.xlsx')
ws = wb.active
ws.move_range("C1:D11", rows=2, cols=2) #this will select C1:D11 & move these values 2 rows DOWN and two columns to the right
wb.save('results1.xlsx')
Create new Table with Data (headers) & find average
 video explaining below code is here
from openpyxl import Workbook, load_workbook
from openpyxl.utils import get_column_letter
from openpyxl.styles import Font
data = {
"Joe": {
"math": 65,
"science": 76,
"english": 98,
"gym": 89,
},
"Bill": {
"math": 55,
"science": 77,
"english": 93,
"gym": 88,
},
"Tim": {
"math": 55,
"science": 86,
"english": 78,
"gym": 49,
},
"Joe": {
"math": 65,
"science": 76,
"english": 98,
"gym": 89,
},
"Jill": {
"math": 95,
"science": 96,
"english": 98,
"gym": 79,
}
}
wb = Workbook()
ws = wb.active
ws.titles = "Grades"
headings = ['Name'] + list(data['Joe'].keys())
ws.append(headings)
for person in data:
grades = list(data[person].values())
ws.append([person] + grades)
for col in range(2, len(data['Joe']) + 2) #start with column 2(which is col B); range is (2, (4 + 2)); range(2,6) gives columns 2,3,4,5
#to find the avg for each column
for col in range(2, len(data['Joe']) + 2) #start with column 2(which is col B); range is (2, (4 + 2))
char = get_column_letter(col
ws[char + "7"] = f"=SUM({char + '2'}:{char + '6'})/{len(data)}" #C7,D7,etc; f string works for python >=3.6
for col in range(1, 6):
ws[get_column_letter(col) + '1'].font = Font(bold=True, color="0099CCFF") #gets A1, B1, etc.
wb.save("NewGrades.xlsx")
Copy One Sheet to Another Workbook
import openpyxl as xl;
# opening the source excel file
filename ="queryTest1.xlsx"
wb1 = xl.load_workbook(filename)
ws1 = wb1.worksheets[0]
# opening the destination excel file
filename1 ="receivingFile1.xlsx"
wb2 = xl.load_workbook(filename1)
ws2 = wb2.active
# calculate total number of rows and
# columns in source excel file
mr = ws1.max_row
mc = ws1.max_column
# copying the cell values from source
# excel file to destination excel file
for i in range (1, mr + 1):
for j in range (1, mc + 1):
# reading cell value from source excel file
c = ws1.cell(row = i, column = j)
# writing the read value to destination excel file
ws2.cell(row = i, column = j).value = c.value
# saving the destination excel file
wb2.save(str(filename1))
import pandas as pd
import openpyxl, pprint #make sure you've: pip install xlrd to be able to use the method 'read_excel()'
#read the excel data
xlsx_source = 'bball.xlsx'
df = pd.read_excel(xlsx_source, sheet_name=0, header=0) #header=0 means that the headers are in the 1st row
df_apples = df[df['Position'] == 'Center'] #find rows where the values in the column named 'Position' is equal to 'Center'
bball.xlsx is here
More. . .
#find rows where the values in the column named 'Position' is equal to 'Center' and paste the results to 'receivingFile1.xlsx', sheet_name='received'
import pandas as pd
import openpyxl, pprint
#read the excel data
xlsx_source = 'bball.xlsx'
df = pd.read_excel(xlsx_source, sheet_name=0, header=0)
#df.head(3)
df_apples = df[df['Position'] == 'Center']
#create excel
df_apples.to_excel('receivingFile1.xlsx', sheet_name='received')
More. . .
import pandas as pd
import openpyxl, pprint
#read the excel data
xlsx_source = 'queryTest2.xlsx'
df = pd.read_excel(xlsx_source, sheet_name=0, header=0)
#df.head(3)
df_apples = df[df['TestResult'] == 'Positive'] #make sure you clean up white space in the column headers, eg, 'TestResult' column header
#create excel
df_apples.to_excel('receivingFile1.xlsx', sheet_name='received')
queryTest2.xlsx is here
More. . . filter by multiple criteria
import pandas as pd
import openpyxl, pprint
#read the excel data
xlsx_source = 'queryTest2.xlsx' # excel sheet is here
df = pd.read_excel(xlsx_source, sheet_name=0, header=0)
#df.head(3)
#df_apples = df[df['TestResult'] == 'Positive']
df_apples = df[(df['TestResult'] == 'Positive') & (df['Status'] == 'Inactive') & (df['ClinNonClin'] == 'Clinical')] #('Salary <= 100000 & Age < 40 & JOB.str.startswith("C").values'))
#filter data to another worksheet
df_apples.to_excel('receivingFile1.xlsx', sheet_name='received')
#print(df_apples)
#print('It is done, boss')
More. . .filter by multiple criteria AND send to different worksheets in Mac OS
import pandas as pd
import openpyxl, pprint
#read the excel data
xlsx_source='queryTest2.xlsx'
df = pd.read_excel(xlsx_source, sheet_name=0, header=0)
#df_apples = df[(df['TestResult'] == 'Positive') & (df['Status'] == 'Inactive') & (df['ClinNonClin'] == 'Clinical')]
#df_apples = df[df['TestResult'] == 'Positive']
df_apples = df[(df['TestResult'] == 'Positive') & (df['Status'] == 'Inactive') & (df['ClinNonClin'] == 'Clinical')]
df_apples1 = df[(df['TestResult'] == 'Positive') & (df['Status'] == 'Inactive') & (df['ClinNonClin'] == 'Non-Clinical')]
#writer = pd.ExcelWriter('
#df_apples.to_excel('
#df_apples1.to_excel('
#df_apples.to_excel(writer, sheet_name='ClinPosInactive')
#df_apples1.to_excel(writer, sheet_name='
with pd.ExcelWriter('
df_apples.to_excel(writer, sheet_name='one')
df_apples1.to_excel(writer, sheet_name='two')
More. . .filter by multiple criteria and string starts with . . .
import pandas as pd
import openpyxl, pprint
#read the excel data
xlsx_source = 'queryTest2.xlsx'
df = pd.read_excel(xlsx_source, sheet_name=0, header=0)
#df.head(3)
#df = pd.read_excel('file.xlsx', skiprows=1) use this if the headers are contained in the 1st two rows; you have header with 2 rows, so by default columns of DataFrame are created by first row.
#df_apples = df[df['TestResult'] == 'Positive']
df_apples = df[(df['TestResult'] == 'Positive') & (df['Status'] == 'Inactive') & (df['ClinNonClin'] == 'Clinical') & (df['Position'].str.startswith("N").values) ] #and find rows where cell value in the 'Position' column starts with capital 'N'
#filter data to another worksheet
df_apples.to_excel('receivingFile1.xlsx', sheet_name='received')
#print(df_apples)
#print('It is done, boss')
More. . .filter by multiple criteria and string starts with . . .and put row count in cell BA1
import pandas as pd
import openpyxl as xl, pprint
#read the excel data
xlsx_source = 'queryTest2.xlsx'
df = pd.read_excel(xlsx_source, sheet_name=0, header=0)
#df.head(3)
#df_apples = df[df['TestResult'] == 'Positive']
df_apples = df[(df['TestResult'] == 'Positive') & (df['Status'] == 'Inactive') & (df['ClinNonClin'] == 'Clinical') & (df['Position'].str.startswith("N").values) ]
#filter data to another worksheet
df_apples.to_excel('receivingFile1.xlsx', sheet_name='received')
# opening the source excel file
filename ="receivingFile1.xlsx"
wb1 = xl.load_workbook(filename)
ws1 = wb1['received'] #use the sheet named 'received'
# calculate total number of rows
mr = ws1.max_row - 1
ws1['BA1'].value = mr
wb1.save(filename)
print(mr)
Sources:
https://kanoki.org/2020/01/21/pandas-dataframe-filter-with-multiple-conditions/
https://www.geeksforgeeks.org/filter-pandas-dataframe-with-multiple-conditions/
https://pandas.pydata.org/docs/reference/api/pandas.DataFrame.to_excel.html
https://cmdlinetips.com/2018/02/how-to-subset-pandas-dataframe-based-on-values-of-a-column/
https://pythonbasics.org/read-excel/
Filter by 3 columns and Copy results to two separate workbooks
import pandas as pd
import openpyxl as xl, pprint
#read the excel data
xlsx_source = 'queryTest2.xlsx'
df = pd.read_excel(xlsx_source, sheet_name=0, header=0)
#df.head(3)
#df_apples = df[df['TestResult'] == 'Positive']
df_apples = df[(df['TestResult'] == 'Positive') & (df['Status'] == 'Inactive') & (df['ClinNonClin'] == 'Clinical') & (df['Position'].str.startswith("N").values) ]
df_oranges = df[(df['TestResult'] == 'Positive') & (df['Status'] == 'Inactive') & (df['ClinNonClin'] == 'Non-Clinical') & (df['Position'].str.startswith("N").values) ]
#filter data to another worksheet
df_apples.to_excel('receivingFile1.xlsx', sheet_name='received')
df_oranges.to_excel('receivingFile2.xlsx', sheet_name='received2')
# opening the source excel file
filename ="receivingFile1.xlsx"
wb1 = xl.load_workbook(filename)
ws1 = wb1['received']
# calculate total number of rows
mr = ws1.max_row - 1
ws1['BA1'].value = mr
wb1.save(filename)
print(mr)
# opening the source excel file
filename ="receivingFile2.xlsx"
wb2 = xl.load_workbook(filename)
ws2 = wb2['received2']
# calculate total number of rows
mr2 = ws2.max_row - 1
ws2['BA1'].value = mr2
wb2.save(filename)
print(mr2)
queryTest2.xlsx is here ; don't forget to create two workbooks: receivingFile1.xlsx and receivingFile2.xlsx
Write Dataframe data to 2 tabs in Excel
import pandas as pd
import numpy as np
df_1 = pd.DataFrame(np.random.rand(20,10)) #generates random numbers into 20 rows & 10 columns
df_2 = pd.DataFrame(np.random.rand(10,1)) #generates random numbers into 10 rows & 1 column
writer2 = pd.ExcelWriter('mult_sheets_2.xlsx')
df_1.to_excel(writer2, sheet_name = 'df_1', index = False)
df_2.to_excel(writer2, sheet_name = 'df_2', index = False)
writer2.save()
Source: https://pythoninoffice.com/save-multiple-sheets-to-one-excel-file-in-python/
Filter from DataFrame into 2 tabs with row count in each tab
import pandas as pd
import openpyxl as xl, pprint
#read the excel data
xlsx_source = 'queryTest2.xlsx'
df = pd.read_excel(xlsx_source, sheet_name=0, header=0)
#df.head(3)
#df_apples = df[df['TestResult'] == 'Positive']
df_apples = df[(df['TestResult'] == 'Positive') & (df['Status'] == 'Inactive') & (df['ClinNonClin'] == 'Clinical') & (df['Position'].str.startswith("N").values) ]
df_oranges = df[(df['TestResult'] == 'Positive') & (df['Status'] == 'Inactive') & (df['ClinNonClin'] == 'Non-Clinical') & (df['Position'].str.startswith("N").values) ]
writer2 = pd.ExcelWriter('mult_sheets_1.xlsx') #we create a new workbook (named 'mult_sheets_1') to hold the data filtered from two criteria: df_apples & df_oranges
df_apples.to_excel(writer2, sheet_name = 'PosClin', index = False)
df_oranges.to_excel(writer2, sheet_name = 'PosNonClin', index = False)
writer2.save()
# opening the source excel file
filename ="mult_sheets_1.xlsx"
wb1 = xl.load_workbook(filename)
ws1 = wb1['PosClin']
# calculate total number of rows
mr = ws1.max_row - 1
ws1['BA1'].value = mr
wb1.save(filename)
print(mr)
# opening the source excel file
filename ="mult_sheets_1.xlsx"
wb2 = xl.load_workbook(filename)
ws2 = wb2['PosNonClin']
# calculate total number of rows
mr2 = ws2.max_row - 1
ws2['BA1'].value = mr2
wb2.save(filename)
print(mr2)
Take Data from 3 Excel files and Combine the Data into One Excel Workbook
import pandas as pd
import openpyxl as xl, pprint
import glob
location = 'C:\\Users\\norml\\Pictures\\Python\\sportsFigures\\*xlsx' #note the double slashes
excel_files = glob.glob(location)
#print(excel_files)
pd.set_option('display.max_rows', 91) #arbitrarily chose '91'
df1 = pd.DataFrame() #this creates an empty dataframe
for afile in excel_files:
df2 = pd.read_excel(afile)
df1 = pd.concat([df1,df2], ignore_index=True)
df1.fillna(value = "NA", inplace = True) #this prevents 'NA" values from being blank in the cells
#now, populate df1 into a folder with the Excel file that will now have the combined data from all 3 files
df1.to_excel('C:\\Users\\norml\\Pictures\\Python\\combinedSportsFiguresData\\AllcombinedSportsFiguresData.xlsx', index = False)
print(df1)
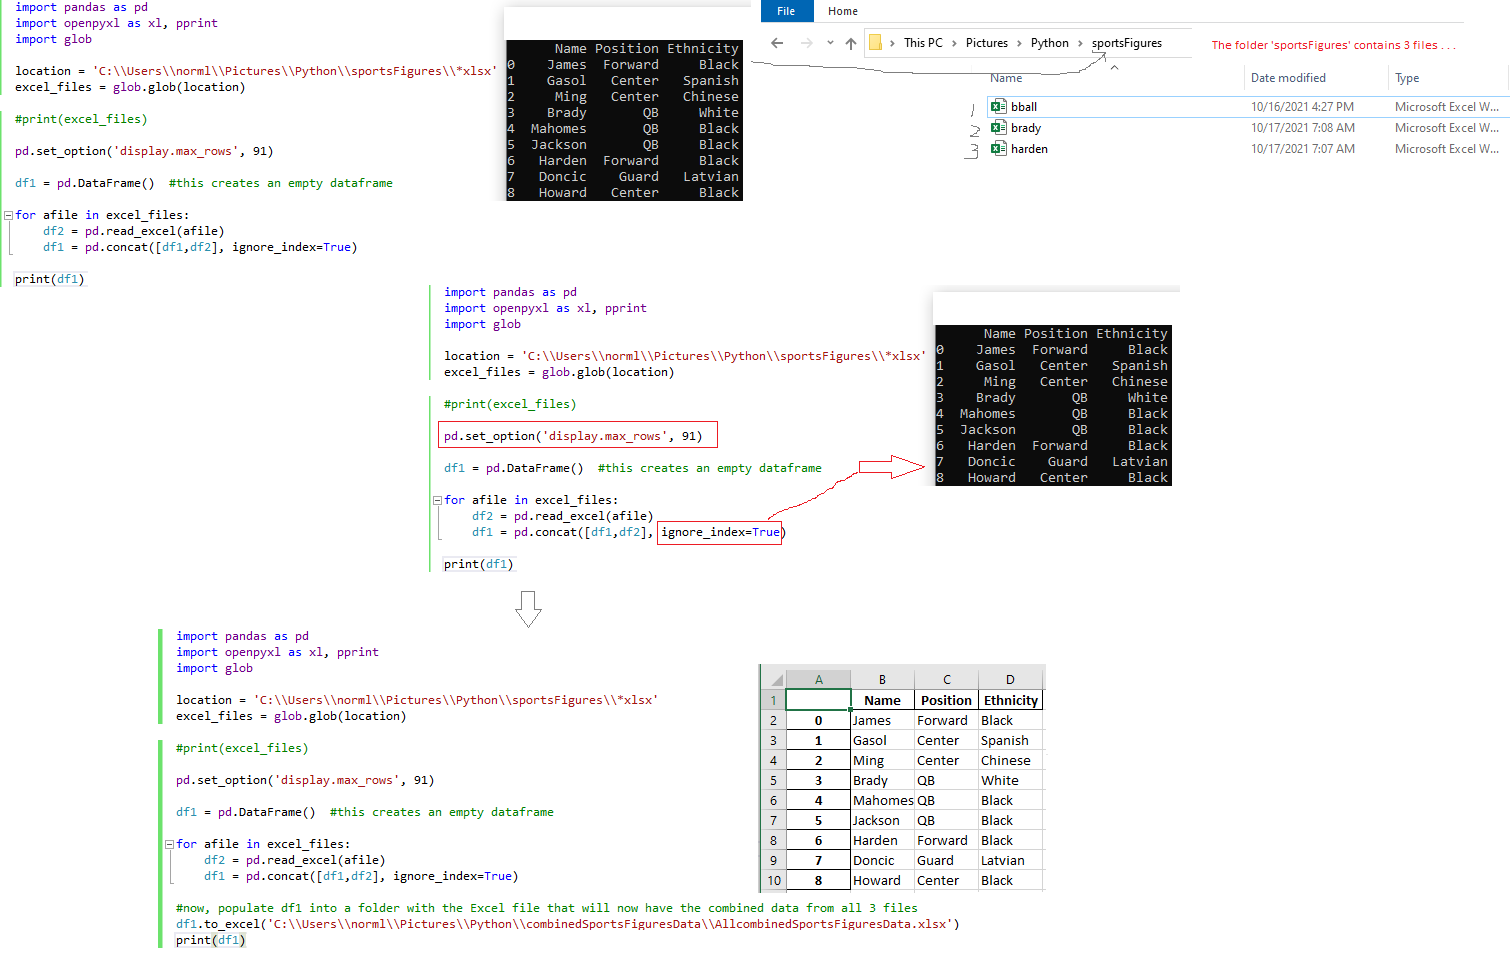
Source: Combine Excel Files with Python | Beginner Friendly | Excel Python Automate with Pandas by The Friendly Coder
combineFilesInOneFolderIntoOneWkbk1_python_10.17.21.mp4 by NL
Combine Files from within OneFolder into One Workbook & Combining Tabs
Video: combineFilesInOneFolderIntoOneWkbkCombiningTabs_python_10.17.21 by NL
import pandas as pd
import openpyxl as xl, pprint
import glob
import os
location = 'C:\\Users\\norml\\Pictures\\Python\\sportsFigures\\*xlsx'
excel_files = glob.glob(location)
writer = pd.ExcelWriter('C:\\Users\\norml\\Pictures\\Python\\combinedSportsFiguresData\\multipleSheets.xlsx')
for afile in excel_files:
#mySheet = afile
#print(mySheet)
mySheet = os.path.basename(afile)
mySheet = mySheet.split(".")[0]
print(mySheet)
df1 = pd.read_excel(afile)
df1.fillna(value = "NA", inplace = True)
df1.to_excel(writer, sheet_name=mySheet, index = False)
writer.save()
SQL lite to QUERY Table and Output Results to New Workbook
import sqlite3
import pandas as pd
from sqlalchemy import create_engine # see top of page to see how to install SQLAlchemy in Windows
file = 'sportingGoods.xlsx' #source of data
output = 'output1.xlsx' #this will create a new workbook called 'output1.xlsx'
engine = create_engine('sqlite://', echo=False)
df = pd.read_excel(file, sheet_name='stuff') #the sheet name from 'sportingGoods.xlsx' is called 'stuff'
df.to_sql('tempDB', engine, if_exists='replace', index=False) #create temporary database called "tempDB" to store the SQL query result
results = engine.execute("SELECT * from tempDB WHERE Object = 'Football'")
final=pd.DataFrame(results, columns=df.columns)
final.to_excel(output, index=False)
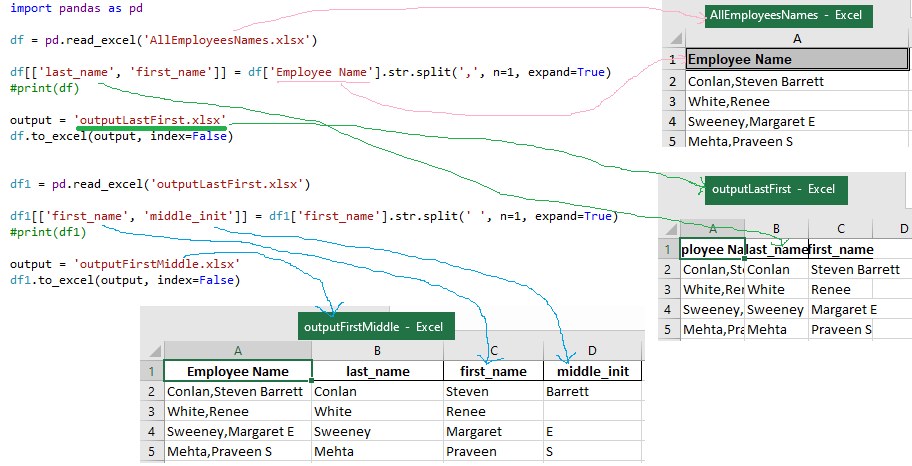
Split Last Name, First Name, Middle Name
import pandas as pd
df = pd.read_excel('AllEmployeesNames.xlsx')
df[['last_name', 'first_name']] = df['Employee Name'].str.split(',', n=1, expand=True)
#print(df)
output = 'outputLastFirst.xlsx'
df.to_excel(output, index=False)
df1 = pd.read_excel('outputLastFirst.xlsx')
df1[['first_name', 'middle_init']] = df1['first_name'].str.split(' ', n=1, expand=True)
#print(df1)
output = 'outputFirstMiddle.xlsx'
df1.to_excel(output, index=False)
Filter into New Separate Workbooks Based on Cell Value
import pandas as pd
excel_file_path = 'training_status.xlsx'
df = pd.read_excel(excel_file_path)
split_values = df['Shift'].unique()
for valueNL in split_values:
df1 = df[df['Shift'] == valueNL]
output_file_name = "The shift_" + str(valueNL) + "_Trainings.xlsx"
df1.to_excel(output_file_name, index=False)
#this will cause new workbooks to be created
Video:
Separate Excel Data into Workbooks by Column Values - Python Pandas Tutorial
Filter into Multiple Separate Tabs WITHIN SAME WORKBOOK Based on Cell Value
import pandas as pd
from pandas import ExcelWriter
excel_file_path = 'training_status.xlsx'
df = pd.read_excel(excel_file_path)
split_values = df['Shift'].unique()
#print(split_values)
writer = pd.ExcelWriter('newList.xlsx', engine='xlsxwriter')
for valueNL in split_values:
df1 = df[df['Shift'] == valueNL]
df1.to_excel(writer, sheet_name= 'Sheet ' + str(valueNL), index=False)
writer.save()
Video explaining above is here
import pandas as pd
from pandas import ExcelWriter
excel_file_path = 'GItrackertest.xlsx'
df = pd.read_excel(excel_file_path)
split_values = df['Team'].unique()
print(split_values)
output_file = 'GIList_output.xlsx'
writer = pd.ExcelWriter(output_file, engine='xlsxwriter')
for valueNL in split_values:
df1 = df[df['Team'] == valueNL]
df1.to_excel(writer, sheet_name= 'Sheet ' + str(valueNL), index=False)
writer.save()
Install Python and Using Python Within Visual Studio Code with MAC OS
Download Visual Studio Code for Mac
Setup Python For Visual Studio Code - macOS (2020)
How to Set up Python Virtual Environment using Visual Studio Code by NL 11.10.21
Create a folder named novTen on Desktop
Create new file & name it 'utility.py' & save it into novTen folder
Open Terminal in Mac:
Normans-iMac-5:~ normanlee$ cd Desktop
Normans-iMac-5:Desktop normanlee$
Normans-iMac-5:novTen normanlee$ python3 -m venv MyDemoEnv
Choose correct Python interpreter
import pandas as pd
import numpy as np
initial_wb = 'A1_11.7.21a.xlsx'
info_wb = 'B1_11.7.21.xlsx'
df_initial = pd.read_excel(initial_wb, engine='openpyxl') #make sure you've 'pip3 install openpyxl' in command terminal
df_info = pd.read_excel(info_wb, engine='openpyxl')
outer_join = pd.merge(df_initial,
df_info,
on ='IDs',
how ='outer')
outer_join.to_csv('
Find Duplicates Based on Column's cell Value & Print Rows & place results in new workbook
import pandas as pd
df = pd.read_csv("A1_11.7.21a.csv")
duplicateDFRow = df[df.duplicated(['IDs'])] #filter by duplicates contained with the column named 'IDs'
print(duplicateDFRow)
import pandas as pd
df = pd.read_csv("A1_11.7.21a.csv") #read from original file containing possible duplicates
duplicateDFRow = df[df.duplicated(['IDs'])] #filter by duplicates contained with the column named 'IDs'
duplicateDFRow.to_csv('dupes11.13.21.csv', index=True) #results are in a new file named 'dupes11.13.21.csv'
Find Duplicates Based on Column's cell Value & Print All Duplicates

import pandas as pd
df = pd.read_csv("glee.csv")
df2 = df[df["Name"].duplicated(keep=False)]
print(df2)
df2.to_csv('dupes11.13.21.csv', index=False)
Replace Characters within Strings in Pandas
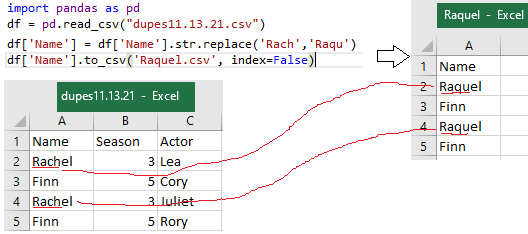
import pandas as pd
df = pd.read_csv("dupes11.13.21.csv")
df['Name'] = df['Name'].str.replace('Rach','Raqu')
df['Name'].to_csv('Raquel.csv', index=False)
Files:
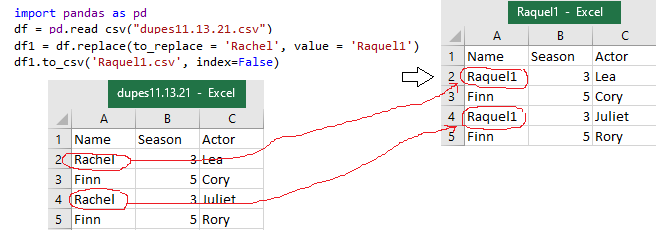
import pandas as pd
df = pd.read_csv("dupes11.13.21.csv")
df1 = df.replace(to_replace = 'Rachel', value = 'Raquel1')
df1.to_csv('Raquel1.csv', index=False)
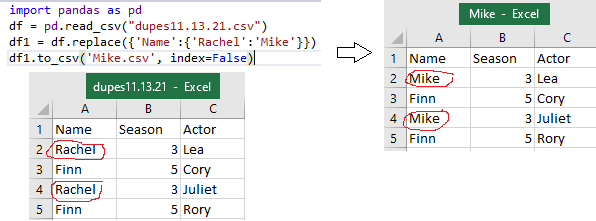
import pandas as pd
df = pd.read_csv("dupes11.13.21.csv")
df1 = df.replace({'Name':{'Rachel':'Mike'}})
df1.to_csv('Mike.csv', index=False)
Filter by Dates Pandas

import pandas as pd
df = pd.read_csv("attractions.csv")
df['DateVisited'] = pd.to_datetime(df['DateVisited'])
df1 = df[(df['DateVisited'] >= '2002-01-01') & (df['DateVisited'] <= '2002-12-31') ] #filter by date between 1/1/02 to 12/31/02
print(df1)
or . . .
import pandas as pd
df = pd.read_csv("attractions.csv")
start_date = "2002-1-1"
end_date = "2002-12-31"
df['DateVisited'] = pd.to_datetime(df['DateVisited'])
df1 = df[(df['DateVisited'] >= start_date) & (df['DateVisited'] <= end_date) ]
print(df1)
Delete Rows Based on Date Criteria in Pandas
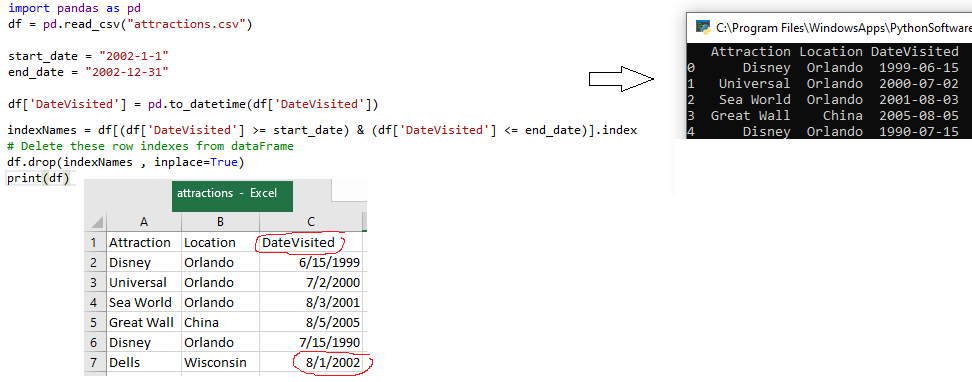
import pandas as pd
df = pd.read_csv("attractions.csv")
start_date = "2002-1-1"
end_date = "2002-12-31"
df['DateVisited'] = pd.to_datetime(df['DateVisited'])
indexNames = df[(df['DateVisited'] >= start_date) & (df['DateVisited'] <= end_date)].index
# Delete these row indexes from df
df.drop(indexNames , inplace=True)
print(df) # note that Dells 8/1/2002 was deleted
df.to_csv('attractions_revised.csv', index=False) #creates a new .csv file named 'attractions_revised.csv'
To find current working directory in Mac OS:
import os
path = os.getcwd()
print(path)
for me in Mac OS, the current working directory is: /Users/normanlee 'so, place your xlsx and csv files in this directory to use with Jupyter notebook
import pandas as pd
df = pd.read_csv("C:\\Users\\norml\\bball.csv") 'in yellow is the current working directory into which you should save your csv or xlsx files
print(df)
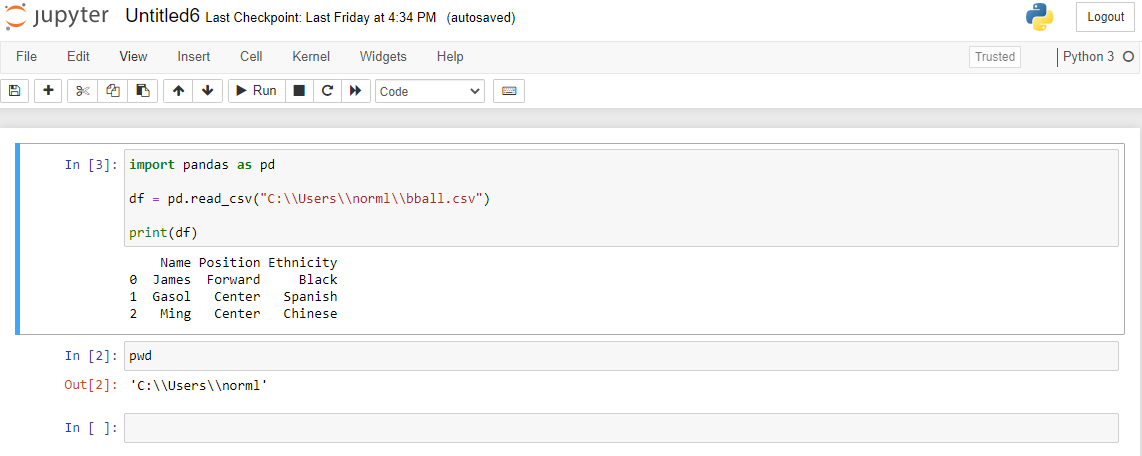
For Surface Pro CRL: my working directory is
C:\\Users\\chris\\pyproj
import pandas as pd
df = pd.read_excel("4.24.22_bk1.xlsx", index_col=0)
print(df)
Source: best . . .
Python & Python Virtual Environment Setup on macOS - Python & Django 3.2 Tutorial Series
In python, create a function that takes a user input and multiplies it by 3
def multiply_by_three():
user_input = float(input("Enter a number: "))
result = user_input * 3
return result
# Example usage:
print(multiply_by_three())
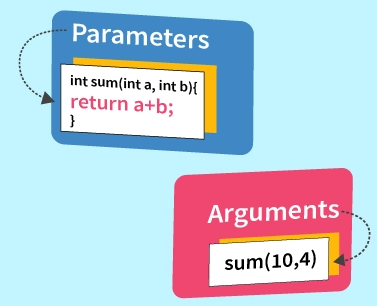
A parameter is a variable in a function definition. It is a placeholder and hence does not have a concrete value. An argument is a value passed during function invocation. In a way, arguments fill in the place the parameters have held for them.
