Cardiac Exam page Heart Sounds here Cardiac Cycle page ECG Basics page Heart Failure page MI page AFib page HTN page
Cardiac Function Curves
How will you react ?? when you encounter:
The SA node sends a wave of depolarization across the atria causing atrial contraction. This same wave of depolarization is conducted down through the AV node, where it pauses temporarily before reaching the ventricles & causing ventricular contraction.
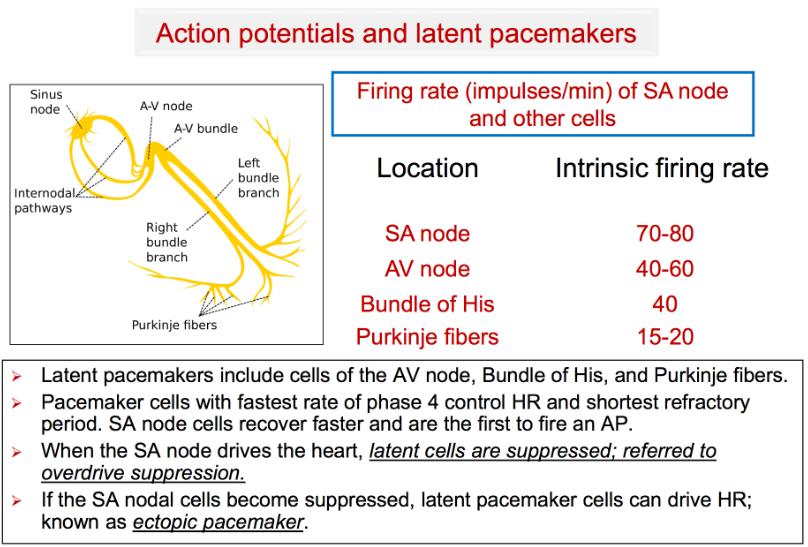
If the SA node fails to depolarize, another pacemaker will take over. The cells of the cardiac conduction system outside the SA node also have the ability to act as pacemakers - with its own intrinsic rate:
The regular rhythm generated by the SA node is not interrupted by all these other pacemakers because the SA node has the fastest intrinsic pacing rate. Every time the SA node fires, it sends out a wave of depolarization that depolarizes the other pacemakers before they can fire.
1. If SA node pauses or stops pacing, another pacemaker will take over.
2. Usually, the pacemaker cell with the next highest intrinsic firing rate will take over & pace at its intrinsic rate, generating an escape rhythm.
E.g., if the SA node stops, an atrial focus may take over & pace at 60-80 bpm; if the atrial foci are also unable to pace, a junctional focus may take over & pace at 40-60 bpm.
3. If the SA node pauses only briefly, a single escape beat may be generated.

Video: Animated electrical conduction with ECG tracing
Right Ventricular Failure
Click here
B-type natriuretic peptide (BNP) is a neurohormone secreted from cardiac ventricles in response to ventricular strain. So, increased BNP suggests heart strain.
Right heart strain can often occur as a result of pulmonary arterial hypertension (and its underlying causes such as massive pulmonary emboli).
Physiology
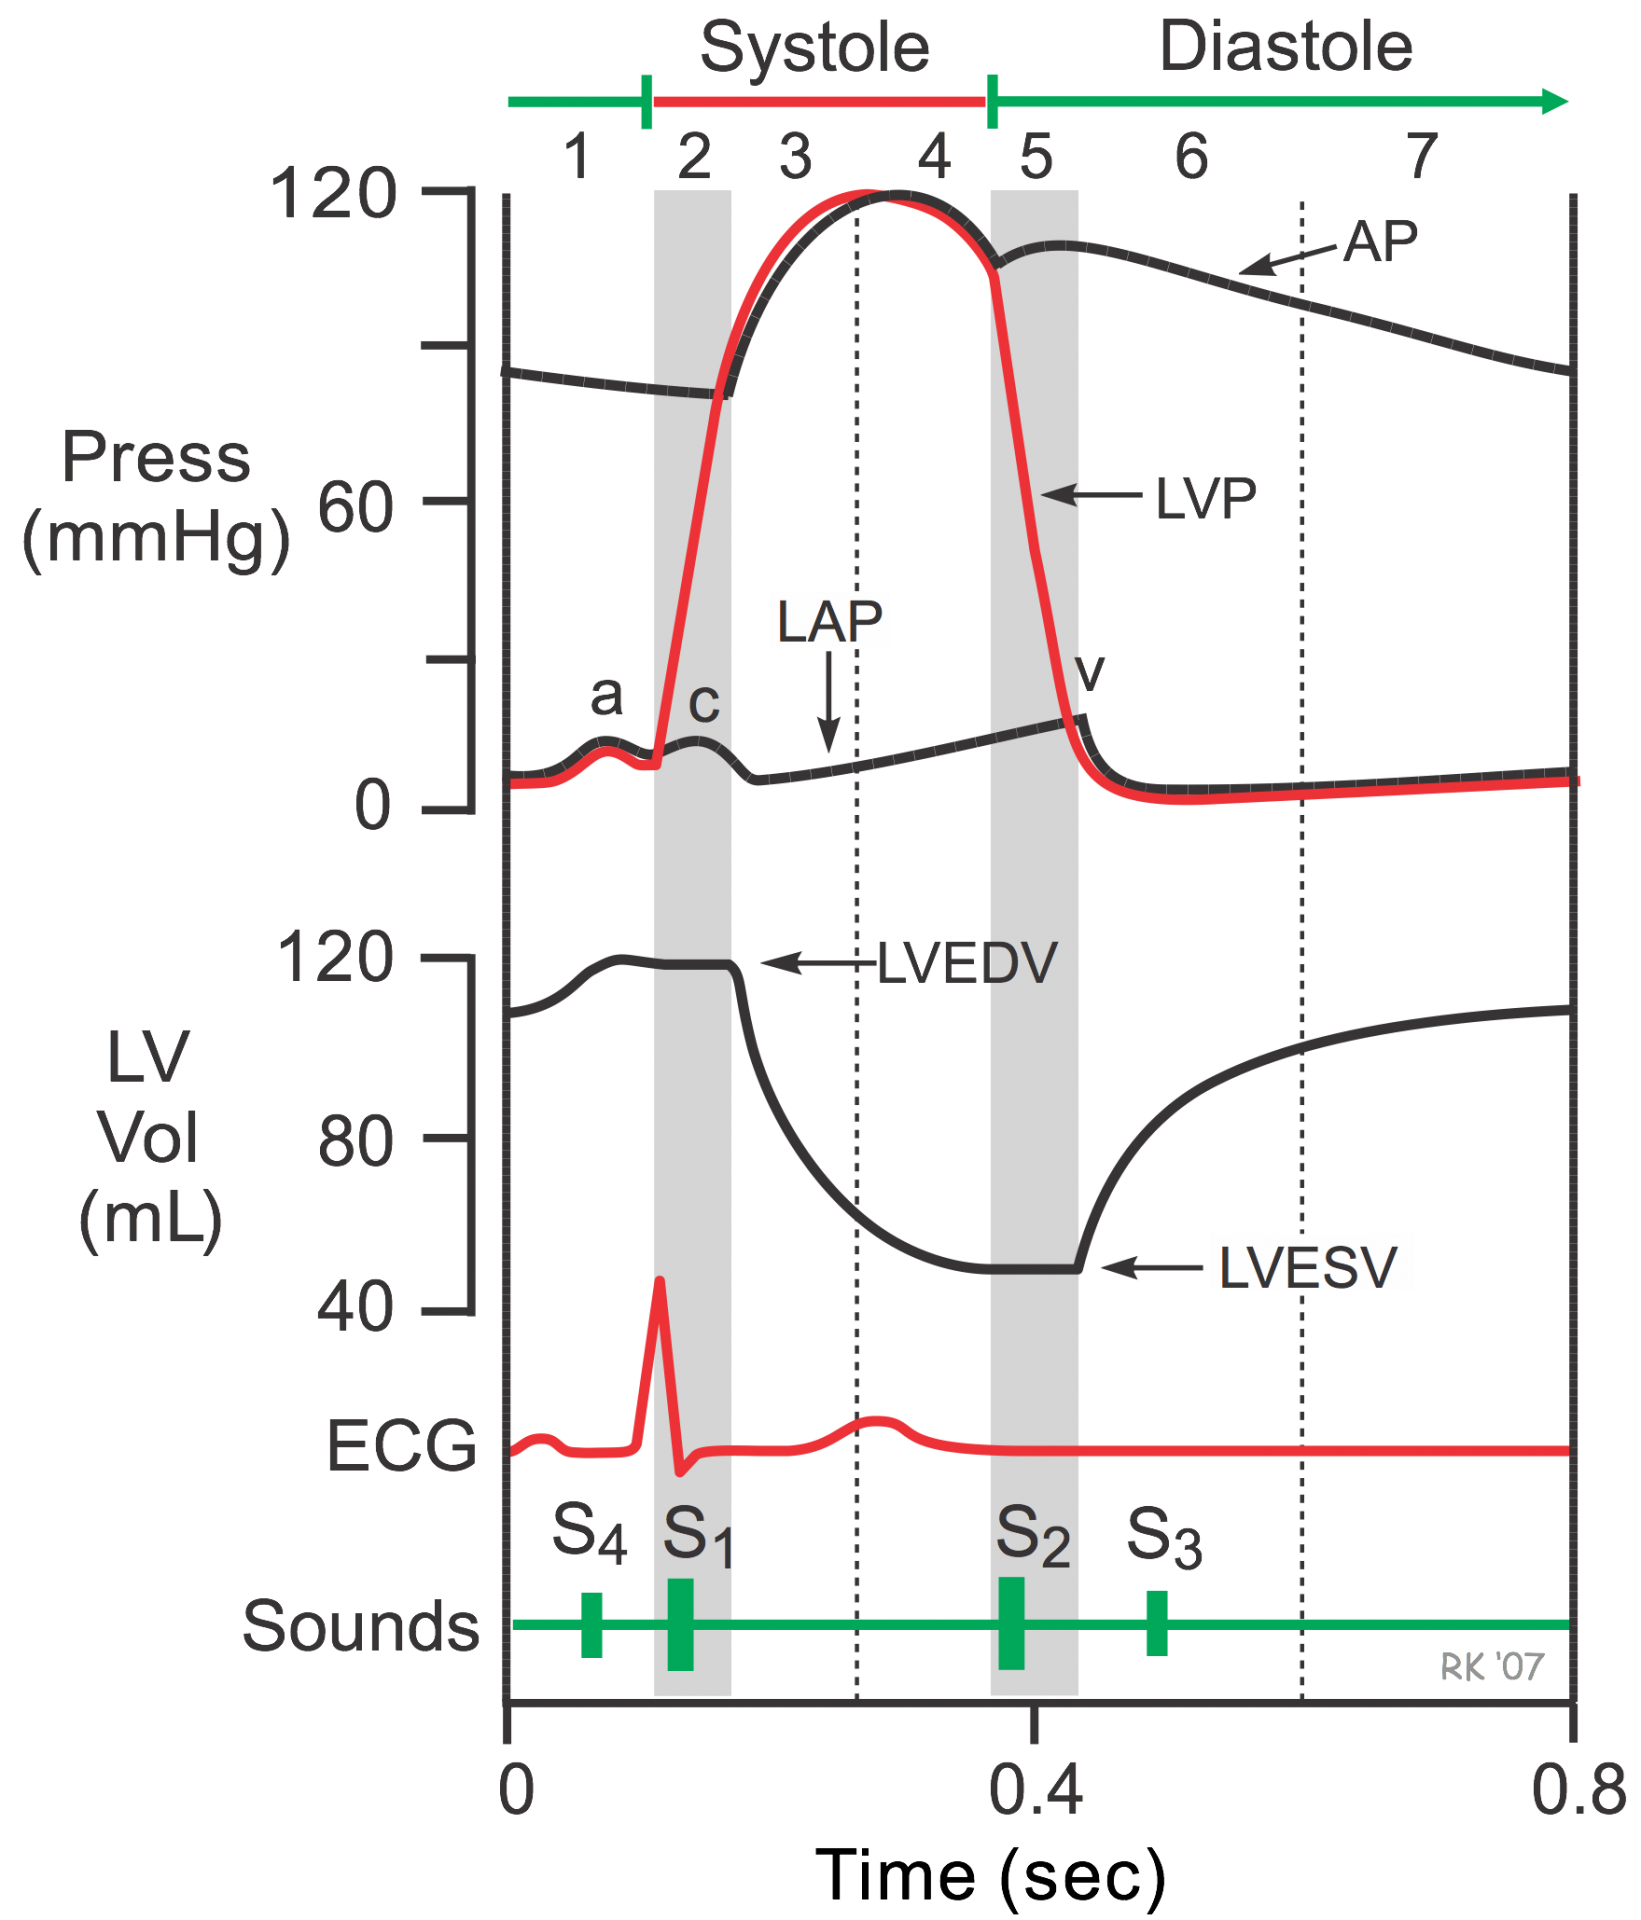
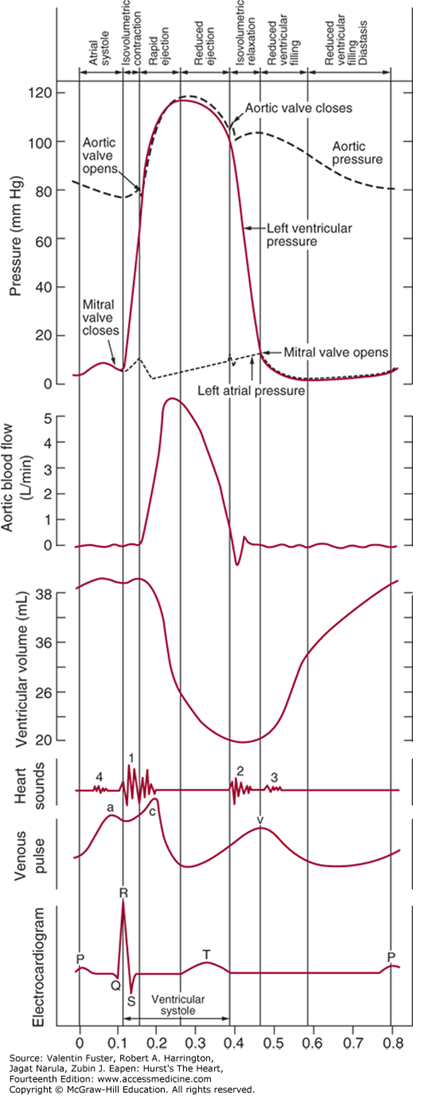
In cardiac physiology, isovolumetric contraction is an event occurring in early systole during which the ventricles contract with no corresponding blood volume change (isovolumetrically). This short-lasting portion of the cardiac cycle takes place while all heart valves are closed.
The isovolumetric contraction causes left ventricular pressure to rise above atrial pressure, which closes the mitral valve and produces the first heart sound. ... The aortic valve opens at the end of isovolumetric contraction when left ventricular pressure exceeds aortic pressure.
During the time period between the closure of the AV valves and the opening of the aortic and pulmonic valves, ventricular pressure rises rapidly without a change in ventricular volume (i.e., no ejection occurs). Ventricular volume does not change because all valves are closed during this phase. Contraction, therefore, is said to be "isovolumic" or "isovolumetric." Individual myocyte contraction, however, is not necessarily isometric because individual myocyte are undergoing length changes. Some individual fibers contract isotonically (i.e., concentric, shortening contraction), whereas others contract isometrically (i.e., no change in length) or eccentrically (i.e., lengthening contraction). Therefore, ventricular chamber geometry changes considerably as the heart becomes more spheroid in shape; circumference increases and atrial base-to-apex length decreases.
The rate of pressure increase in the ventricles is determined by the rate of contraction of the muscle fibers, which is determine by mechanisms governing excitation-contraction coupling. The maximal rate of pressure change during this phase is termed "dP/dtmax."
The "c-wave" noted in the LAP may be due to bulging of mitral valve leaflets back into left atrium. Just after the peak of the c wave is the x'-descent.
Isovolumetric relaxation (d-e): When the ventricular pressures drop below the diastolic aortic and pulmonary pressures (80 mmHg and 10 mmHg respectively), the aortic and pulmonary valves close producing the second heart sound (point d). This marks the beginning of diastole.
Sources:
https://www.cvphysiology.com/Heart%20Disease/HD002b
Cardiac Cycle
The cardiac cycle integrates pressure, volume, and electrocardiographic and valvular movements during the systolic and diastolic periods. The ECG illustrates the electrical events that drive the mechanical events of the cardiac cycle. The P wave of the ECG represents atrial depolarization, which is followed by contraction and an increase in pressure in the atria (atrial systole). The AV valves are open, and there is no valve between the atria and veins, so this small increase in pressure is also evident in the ventricle (a wave) and in the veins. Most ventricular filling occurs early in ventricular diastole, but atrial contraction at the end of ventricular diastole causes a small increase in ventricular volume. The QRS wave of the electrocardiogram represents ventricular depolarization, which is followed by contraction and an increase in pressure in the ventricles (ventricular systole). The T wave of the ECG represents ventricular repolarization and relaxation of the ventricular muscles (ventricular diastole).
Pressures on the left side of the heart are normally higher than pressures on the corresponding right side. Pressure range in the left atrium is 2 to 8 mm Hg, and in the right atrium is 0 to 5 mm Hg. Pressure in the left ventricle is 2 to 120 mm Hg, and in the right ventricle is 0 to 35 mm Hg. Pressure in the aorta is 80 to 120 mm Hg, and in the pulmonary artery is 10 to 25 mm Hg. The higher pressures on the left side mean that any disruption in the interatrial septum or interventricular septum will result in blood flow from the left side of the heart to the right side of the heart.
All Valves Closed
This phase of the cardiac cycle begins with the appearance of the QRS complex of the ECG, which represents ventricular depolarization. This triggers excitation-contraction coupling, myocyte contraction and a rapid increase in intraventricular pressure. Early in this phase, the rate of pressure development becomes maximal. This is referred to as maximal dP/dt.
The AV valves close when intraventricular pressure exceeds atrial pressure. Ventricular contraction also triggers contraction of the papillary muscles with their chordae tendineae that are attached to the valve leaflets. This tension on the the AV valve leaflets prevents them from bulging back into the atria and becoming incompetent (i.e., “leaky”). Closure of the AV valves results in the first heart sound (S1). This sound is normally split (~0.04 sec) because mitral valve closure precedes tricuspid closure.
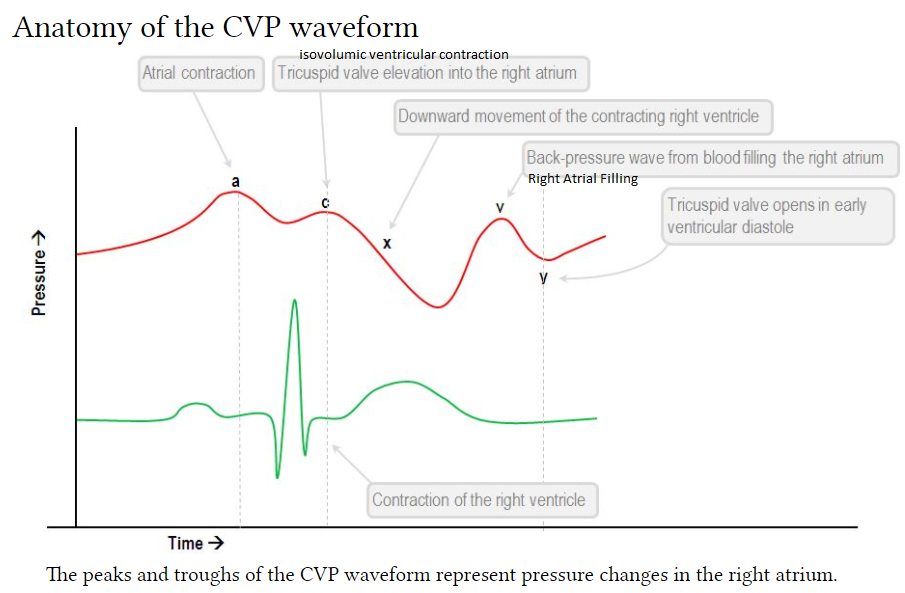
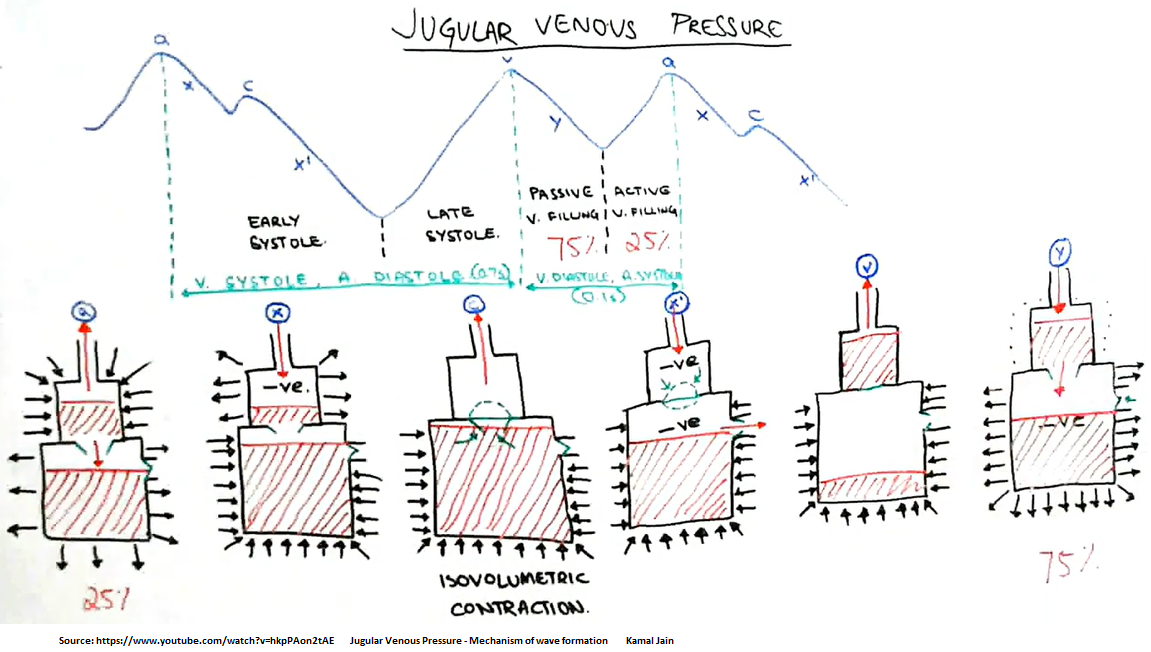
The CVP tracing contains 3 positive deflections—the a, c, and v waves—and two negative slopes—the x and y descents (Fig. 10.2). The waves correspond to atrial contraction, isovolemic ventricular contraction including tricuspid bulging, and right atrial filling, respectively.
What is the C wave? A component of right atrial and pulmonary capillary wedge pressure waves. It reflects the closing of the tricuspid valve at the beginning of ventricular systole. An abnormal configuration is seen in increased right heart pressure and with abnormalities of the tricuspid valve.
The v-wave represents the passive filling before the opening of the mitral valve [right atrial filling]. This will occur directly with T-wave.
The y-descent represents the opening of the mitral valve and the rapid filling of the ventricle from the atrium.
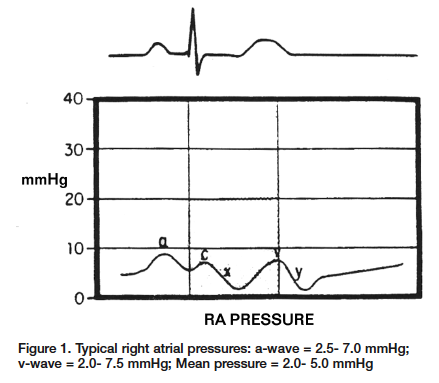
Let’s begin with the waveform of the right atrium (Figure 1). The 1st positive deflection is the a-wave. This is generated when the atrium contracts, which causes the increased pressure within the atrium. This occurs during the P-wave on the ECG. The next increase in pressure is caused during ventricular contraction. The sudden closure of the tricuspid valve and the rapid increase in ventricular pressures causes the valve to bulge into the right atrium. This wave is called the c-wave and can be found directly following the QRS complex on the ECG. Note: The c-wave is very slight and not seen all of the time. The first major negative deflection of the waveform is the x-descent. This sudden drop in pressure occurs as a result of depolarization of the right atrium and at this point the tricuspid ring is actually being pulled into the ventricle. This occurs between the QRS complex and the T-wave on the ECG. The v-wave can be seen as a result of passive filling of the right atrium as the tricuspid valve is closed. This can be located during the T-wave on the ECG. The final negative deflection is the y-descent. This is a result of the rapid fall in right atrial pressure as the tricuspid valve opens and the right atrium empties into the right ventricle during ventricular diastole. This can be found after the T-wave on the ECG.
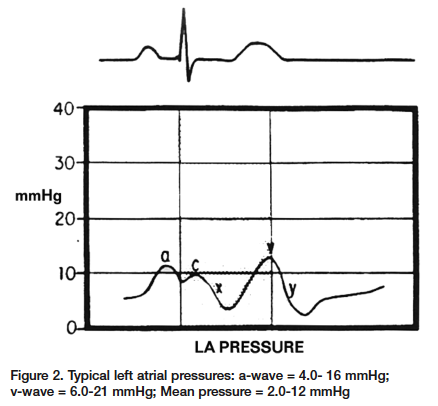
Left Atrial Waveform The left atrial waveform is very similar to the right atrial waveform; however, the a-wave and the v-wave are larger because of the lower compliance found within the left atrium (Figure 2). Once again, the a-wave is produced from the increased pressure during the atrial contraction. This will coincide with the P-wave of the ECG. The c-wave in this case is a result of the left ventricular contraction and subsequent bulging of the mitral valve into the left atrium, found directly following the QRS complex. The x-descent represents atrial relaxation. This occurs between the QRS complex and the T-wave on the ECG. The v-wave represents the passive filling before the opening of the mitral valve. This will occur directly with T-wave. The y-descent represents the opening of the mitral valve and the rapid filling of the ventricle from the atrium.
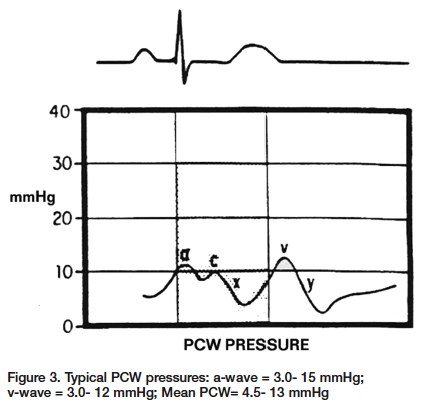
Pulmonary Capillary Wedge Pressure (PCWP) Pulmonary capillary wedge pressure (PCWP) acquired during during a right heart procedure is used to represent left atrial pressure. This method eliminates the need for a transseptal puncture to acquire left atrial pressure. The PCWP and left atrial pressures are the same; however, the PCWP pressure shows slight damping and is shifted to the right in relation to the ECG (Figure 3). The time delay is the result of the left arterial pressure waveform having to travel through the pulmonary veins, pulmonary capillaries and pulmonary arteries before arriving at the monitoring catheter, located in a pulmonary artery. The a-wave and the v-wave are the most important aspects of the right heart pressures. Changes in the size of either the a-wave or v-wave can give valuable clues for determining a correct diagnosis. As previously stated, the a-wave is the pressure obtained during atrial contraction. Increases in the a-wave are caused by pathological conditions that would directly generate higher pressures within the atrium. Mitral or tricuspid stenosis are good examples of direct increases in pressure when the atrium contracts (Figure 4). Other examples would include any disease states that decrease compliance of the atrial wall. Decreases in atrial wall compliance can be found with pericardial diseases, such as constrictive pericardidis or cardiac tamponade. Regarding any increases in atrial pressures, we must also keep in mind any increases in the volume of blood being returned to the atrium. This increased volume of blood return will increase the pressure within the atrium, ultimately increasing the a-wave. The best example of an increased volume would be in cases of mitral or tricuspid insufficiencies. Inversely, in cases of atrial fibrillation there would be no atrial contraction and therefore, no a-wave present. The absence or decreased a-wave can also be seen in cases of severe hypovolemia. The significance of the v-wave is related to any pathological condition that would affect atrial filling during systole against closed atrial-ventricular valves. The size of the v-wave is determined partially by the amount of blood entering the atrium. The most common cause of large v-waves is mitral regurgitation (MR)1 (Figure 5). Giant v-waves can be seen in cases of acute MR (e.g., ruptured chordae tendineae). V-waves greater than twice the mean pulmonary capillary wedge pressures are suggestive of severe MR.2 Other examples that would show an increased v-wave are hypervolemia, atrial septal defects, and atrial fibrillation (all of which are related to increased volume returning to the atrium). Over the last several years, hemodynamic computer systems have improved tremendously. However, they are not infallible. The systems can mislabel a, x, y and v waves. As professionals we need to review the information given to us by the computer and using our hemodynamic knowledge, make adjustments as necessary or confirm the system findings. During your next right heart catheterization, get back to the basics, test your knowledge and apply it to the patient’s condition. You will soon find these routine cases more interesting, and more importantly, you will find that you can be a much more valuable member to your cath lab team.
Source: https://www.cathlabdigest.com/articles/The-ABCs-A-V-Right-Atrial-Left-Atrial-PCW-Pressures
Patent Foramen Ovale
This causes a Right to Left intracardiac shunt.
There are 2 kinds of holes in the heart. One is called an atrial septal defect (ASD), and the other is a patent foramen ovale (PFO). Although both are holes in the wall of tissue (septum) between the left and right upper chambers of the heart (atria), their causes are quite different. An ASD is a failure of the septal tissue to form between the atria, and as such it is considered a congenital heart defect, something that you are born with. Generally an ASD hole is larger than that of a PFO. The larger the hole, the more likely there are to be symptoms.
PFOs, on the other hand, can only occur after birth when the foramen ovale fails to close. The foramen ovale is a hole in the wall between the left and right atria of every human fetus. This hole allows blood to bypass the fetal lungs, which cannot work until they are exposed to air. When a newborn enters the world and takes its first breath, the foramen ovale closes, and within a few months it has sealed completely in about 75% of us. When it remains open, it is called a patent foramen ovale, patent meaning open. For the vast majority of the millions of people with a PFO, it is not a problem, even though blood is leaking from the right atrium to the left. Problems can arise when that blood contains a blood clot.
Although the prevalence of PFO is about 25% in the general population, this increases to about 40 to 50 % in patients who have stroke of unknown cause, referred to as cryptogenic stroke.
Cardiac Cycle
Jugular Venous Pressure (JVP)
Video here
LBBB vs RBBB
Go to section
TEE Simulation
https://www.youtube.com/watch?v=3t-oAVATnOg -- TEE Simulation Training Scottdale
Antiarrythmic Drugs
Articles:
Antiarrythmic Drugs: Risks & Benefits
Pulmonary Hypertension
From Left Heart Failure
Vascular Waterfall
See my video here
Dopamine
Low infusion rates (0.5 to 2 micrograms/kg per minute) act on the visceral vasculature to produce vasodilation, including the kidneys, resulting in increased urinary flow.
Orthostatic Hypotension
Orthostatic hypotension is defined as a decrease in systolic BP of 20 mm Hg or a decrease in diastolic BP of 10 mm Hg within three minutes of standing when compared with blood pressure from the sitting or supine position. It results from an inadequate physiologic response to postural changes in blood pressure. Orthostatic hypotension may be acute or chronic, as well as symptomatic or asymptomatic. Common symptoms include dizziness, lightheadedness, blurred vision, weakness, fatigue, nausea, palpitations, and headache. Less common symptoms include syncope, dyspnea, chest pain, and neck and shoulder pain. Causes include dehydration or blood loss; disorders of the neurologic, cardiovascular, or endocrine systems; and several classes of medications. Evaluation of suspected orthostatic hypotension begins by identifying reversible causes and underlying associated medical conditions. Head-up tilt-table testing can aid in confirming a diagnosis of suspected orthostatic hypotension when standard orthostatic vital signs are nondiagnostic; it also can aid in assessing treatment response in patients with an autonomic disorder. Goals of treatment involve improving hypotension without excessive supine hypertension, relieving orthostatic symptoms, and improving standing time. Treatment includes correcting reversible causes and discontinuing responsible medications, when possible. Nonpharmacologic treatment should be offered to all patients. For patients who do not respond adequately to nonpharmacologic treatment, fludrocortisone, midodrine, and pyridostigmine are pharmacologic therapies proven to be beneficial.
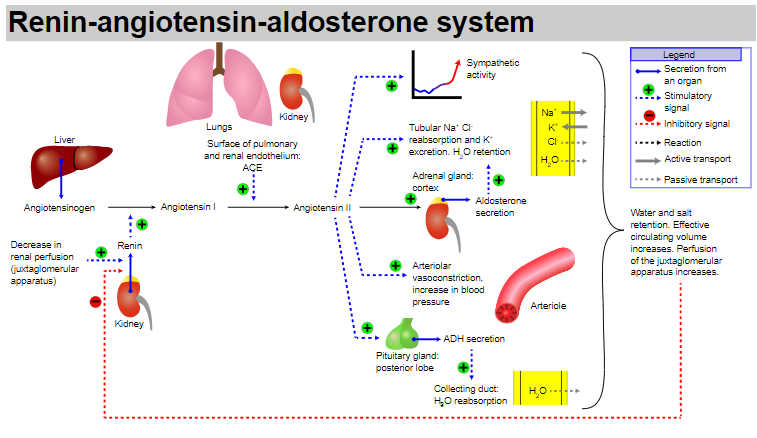
RENIN-ANGIOTENSIN-ALDOSTERONE
CARDIAC TAMPONADE
Right Atrial Collapse
greater than 1/3 of the cycle is probably the most specific
Right Ventricular Collapse
If the RV is collapsing when the mitral valve is open, then that is specific for tamponade
IVC
Lead pipe is specific, flat doesn't rule it out (if pt is volume depleted, etc.)
Videos:
Jacob Avila 2021 pericardial tamponade video
Pericardial effusion video
Wall Stress

Imagine that the tightrope walker is the volume of blood in the LV or RV. More blood in the ventricle is like having a heavier tightrope walker; ie, more end-doastolic volume means more downward force on the ventricle, meaning that the surround myocardial wall tissue MUST pull with more force (sideways) to balance the downward force of the extra volume of blood.
Video explaining wall stress is here.
Wall stress = afterload
Cardiovascular Circuit
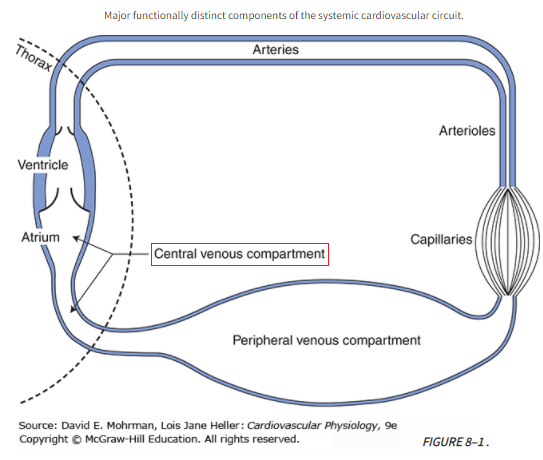
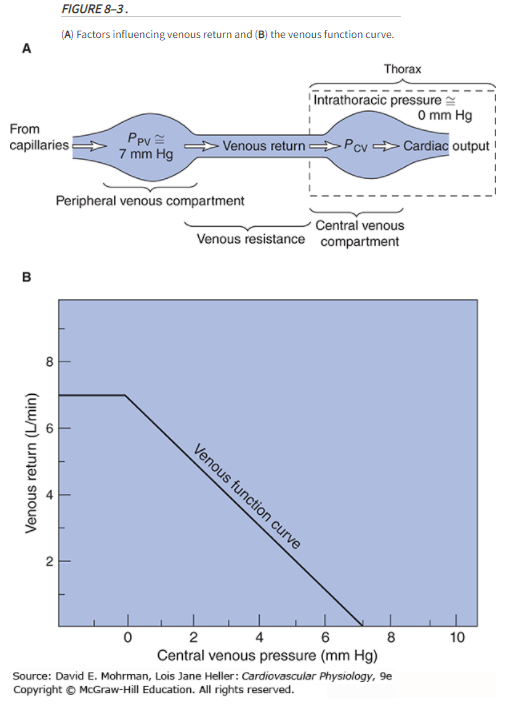 Ppv = peripheral venous pressure; Pcv = central venous pressure
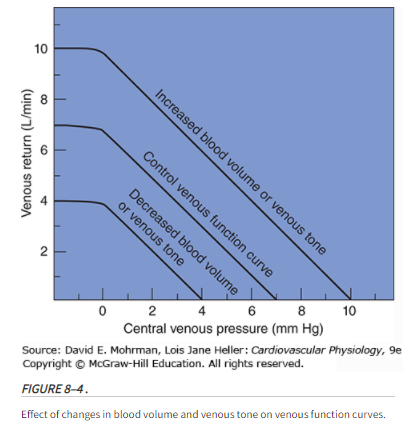
Mean Circulatory Filling Pressure (MCFP)
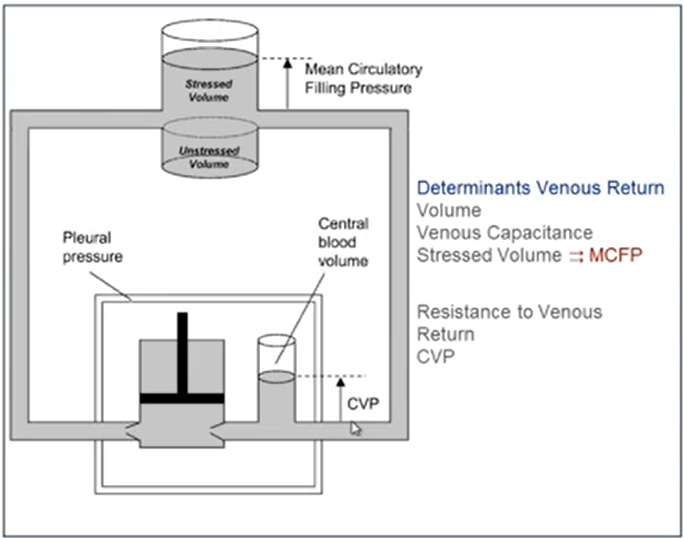
Mean circulatory filling pressure (MCFP) is the pressure that would be measured at all points in the entire circulatory system if the heart were stopped suddenly & the blood were redistributed instantaneously in such a manner that all pressures were equal.
Mean circulatory filling pressure (MCFP) is the pressure in the entire circulatory system in the absence of flow. It is the pressure exerted by the walls of the circulation (including the heart and pulmonary vessels) on its fluid content, and so can be thought of as a measure of the elastic recoil potential stored in those walls. Mine: you can view MCFP as the "stressed volume" that contributes to venous return.
Vascular capacitance is a major factor influencing filling of the right heart and therefore has a critical effect on cardiac output (C.O.) in the intact circulatory system. A measure of the mean circulatory filling pressure (Pmcf) is a critical component in defining the characteristics of overall vascular capacitance.
The smooth muscle in the walls of the vasculature (primarily the veins) can be stimulated to contract to increase the mean pressure (Pmcf) or redistribute the blood volume to other parts of the system.
Changes in Pmcf thus provide a uniquely valuable measure of the changes in the overall level of venomotor activity in the body.
In practice, Pmcf (usually ~ 7 mmHg) is estimated by measuring the central venous pressure (Pcv) after cardiac arrest when the central arterial and venous pressures are equal (ie, ABP = CVP).
Note: Unstressed volume is the blood volume contained in a vessel at zero distending pressure.
Stressed volume is the additional volume above the unstressed volume that is associated with a positive transmural (positive transmural pressure = distending) pressure. It is computed as the mean filling pressure times the compliance.
The "unstressed" volume is said to be a volume of fluid (presumably, blood) in the circulatory system which does not produce any "stress" on the walls, i.e. where measuring the MSFP would yield a pressure of 0 mmHg. According to Young (2010) and Magder (2016), "unstressed volume" describes about 85% of the total venous blood volume: in a circulation with minimal sympathetic tone, only about 15% of the total blood volume is contributing to generating the MSFP.
MCFP & MSFP is usually about 7-8 mmHg
This is also the pressure in the small (<1mm) venules
This pressure in the venules is thought to remain relatively constant irrespective of the cardiac output, and is said to be the "pivot pressure" of the circulation
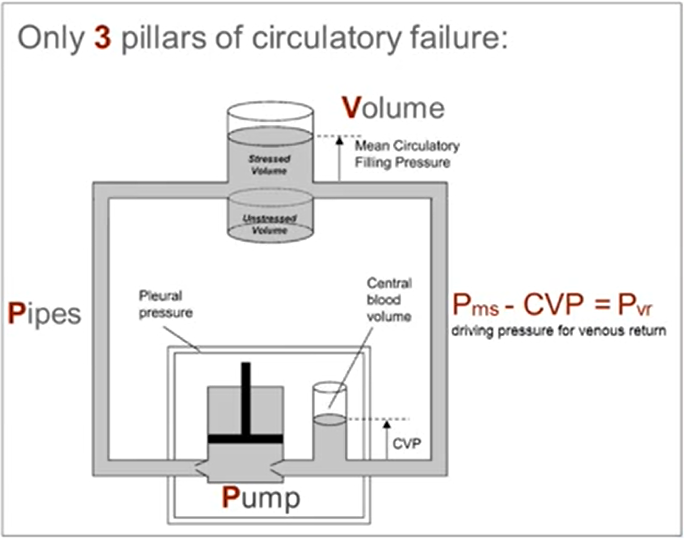
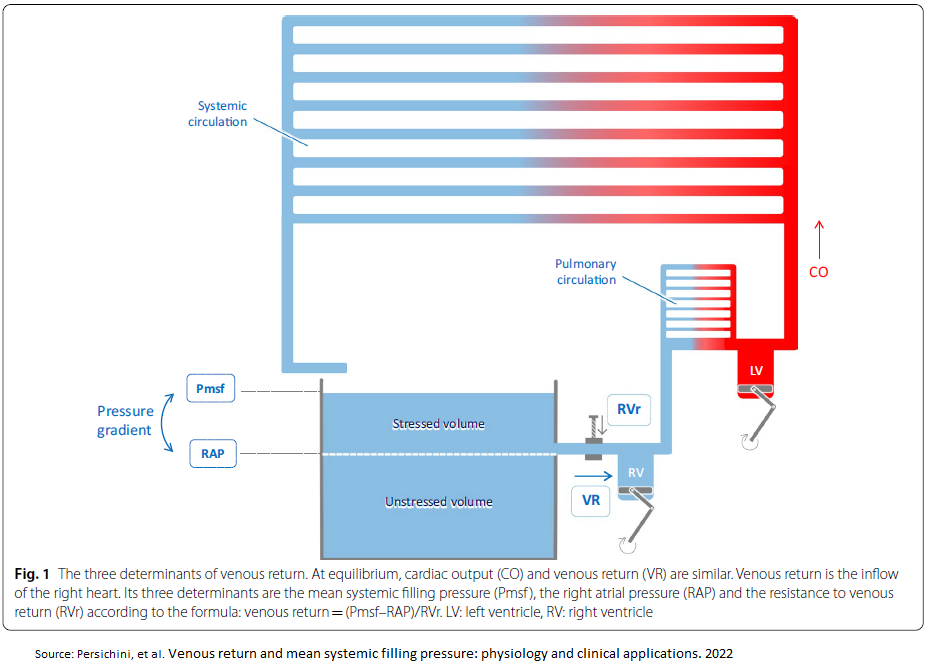
Mean systemic filling pressure (MSFP or Pms) is the pressure in only the systemic circuit, i.e. ignoring the heart & pulmonary circulation, also in the absence of flow. This is usually the pressure people are interested in when they are discussing cardiac preload &vascular function curves, because this is the pressure which is thought to push blood towards the right atrium along a pressure gradient. Mean systemic filling pressure is thus not a function of cardiac pumping.
The volume that fills and stretches the elastic structures of the vasculature produces a pressure that provides the potential energy for the circulatory system. This pressure is determined by the volume and total compliance of the vasculature and is called mean systemic filling pressure (MSFP).
The volume filling the compliant vessels of the vasculature provides an elastic recoil pressure, which is the major source of energy for the flow of blood to the right heart. Pra acts as a backpressure to this flow, & the heart can regulate cardiac output by regulating Pra. The heart also restores the volume that drains from the systemic circulation and maintains MSFP.
The "unstressed" volume is said to be a volume of fluid (presumably, blood) in the circulatory system which does not produce any "stress" on the walls, i.e. where measuring the MSFP would yield a pressure of 0 mmHg. According to Young (2010) and Magder (2016), "unstressed volume" describes about 85% of the total venous blood volume: in a circulation with minimal sympathetic tone, only about 15% of the total blood volume is contributing to generating the MSFP.
Two main factors which determine the MSFP:
Mean cardiopulmonary filling pressure (MCPFP) is the mean pressure in the motionless cardiac chambers and the pulmonary circulation. It is usually about 3 mmHg higher.
The main determinants of MCFP and MSFP are total blood volume & venous resistance
Of the total blood volume, only about 15% exerts the pressure, and the remaining 85% is said to be "unstressed volume", which theoretically exerts no pressure (or minimal pressure) on the walls of the vessels.
The stressed blood volume is the amount of blood under vascular tension that contributes to Psf & participates in venous return. Normally the majority of the blood volume is unstressed & does not contribute to Psf or venous return
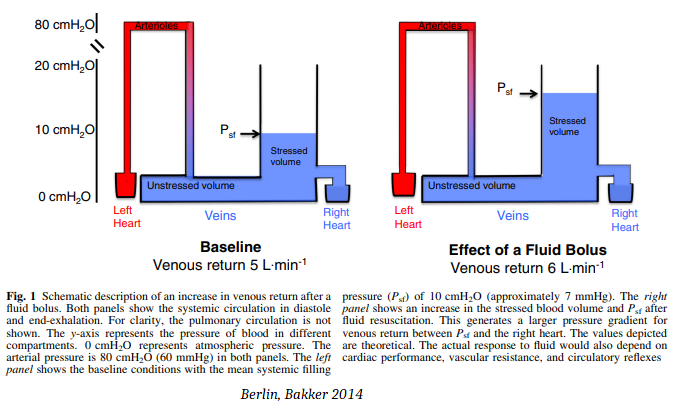
Normally, a pressure gradient of just 7 mmHg sustains cardiac output. As shown in Fig. 1 above, increasing the gradient between Psf and the right atrium increases the force driving venous return. High right atrial pressure is a backpressure that impedes venous return. Right atrial pressure is a determinant of cardiac output only insofar as it is kept low to allow cardiac filling. The circulation must keep the Psf higher than right atrial pressure to maintain cardiac preload. Right atrial pressure rises as a result of filling—it is not a cause of filling.
Equalization of right atrial pressure & the mean systemic filling pressure stops venous return & cardiac output. Equalization can occur if Psf falls as a result of volume depletion and venodilation, or if there is a pathological elevation of right atrial pressure.
Interventions such as fluids or vasopressors will recruit cardiac output only if they increase the gradient for venous return and the heart can accommodate the increased return.
Sources:
https://derangedphysiology.com/main/cicm-primary-exam/required-reading/cardiovascular-system/Chapter%200284/concept-mean-systemic-filling-pressure
https://www.youtube.com/watch?v=HLn56CX8GAU MSFP by Jan Bakker
Berlin D, Bakker. Understanding venous return. J. Intensive Care Med (2014) 40:1564–1566.
Note that the pressure in the arterial system has little direct effect on Psf & the gradient for venous return. For example, increasing systemic arterial pressure with a pure arterial constrictor (angiotensin) raises systemic blood pressure without increasing venous return and cardiac output [9]. However, balanced vasoconstrictors such as norepinephrine may be able to increase the gradient for venous return and cardiac output.
Venous Return
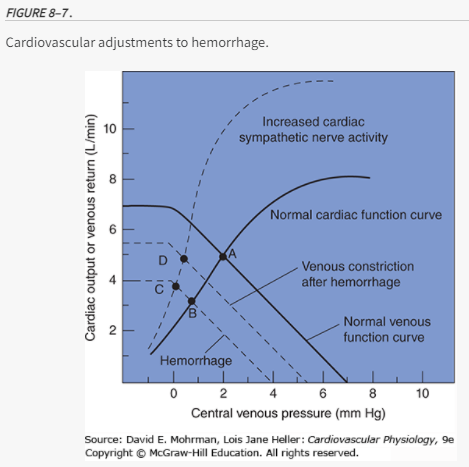
An increase in venous return comes from an increase in stressed volume, decrease in venous compliance(mine: ie, stiffer veins from sympathetic activation), decrease in resistance to venous return and a decrease in right atrial pressure (RAP).
Determinants of venous return
In steady state, cardiac output must equal the return of blood to the heart. This in turn is determined by the mechanical characteristics of the circuit, which is called circuit function. This includes stressed vascular volume, venous compliance, resistance to venous return & the outflow pressure for the circuit, which is RAP. RAP is controlled by cardiac function & the interaction of cardiac function & circuit function determine cardiac output. An important concept for the understanding of venous return is that of stressed & unstressed volume. The venous system, like any other elastic structure, will fill with a certain volume, called the ‘unstressed’ volume, without changing the pressure or causing distention of the structures. Unstressed volume represents as much as 25% of total blood volume & constitutes a significant reservoir for internally recruiting volume into the system. The difference between the total volume in the system & the unstressed volume is the relevant volume for causing pressure in the filling chamber, the stressed volume. The equivalent pressure in the veins & venules to the hydrostatic pressure filling the system is called mean systemic pressure (Pms). It is determined by the volume filling the veins & the compliance of the veins. The term that is used for describing the relationship of the total volume for a given pressure is ‘capacitance’ and takes into account both stressed & unstressed volume. This is not to be confused with the term compliance, which is the change in volume for the change in pressure.
Vascular capacitance is determined by the tone in the walls of the small venules & veins. Contraction of smooth muscles in these vessels due to neurosympathetic activation or exogenous catecholamines can decrease venous capacitance by converting unstressed volume into stressed volume, thus raising mean systemic pressure.
Effect of PEEP on venous return
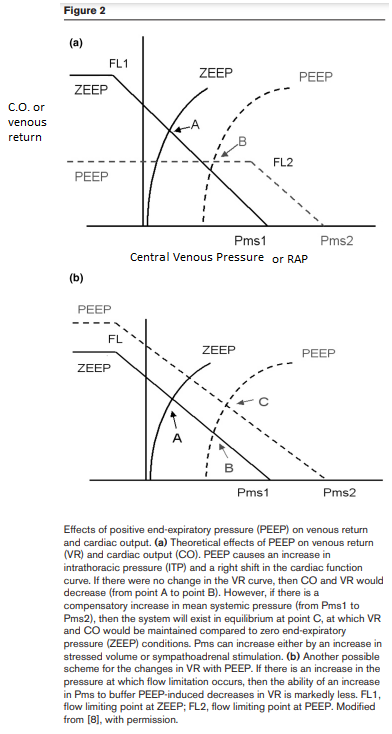
As the right atrium is a highly compliant structure, RAP would reflect variations in intrathoracic pressure (ITP). Any increase in PEEP, by increasing lung volume, & thus ITP, is expected to decrease venous return by decreasing the pressure gradient. The cardiac function curve is displaced rightward by the amount by which ITP is increased, thus maintaining the same transmural pressure-cardiac output relationships. Postulating that Pms does not change with PEEP, this would move the intersection of the cardiac function & the venous return curves ‘downward’ on the venous return curve (Fig. 2a, point B). As a result, the gradient for venous return decreases, decelerating venous blood flow, decreasing RV filling and, consequently, decreasing RV SV. However, as suggested by Scharf et al. and later demonstrated in experimental studies, PEEP also increases Pms, thus preserving the gradient for venous return.
Ventricular Interdependence
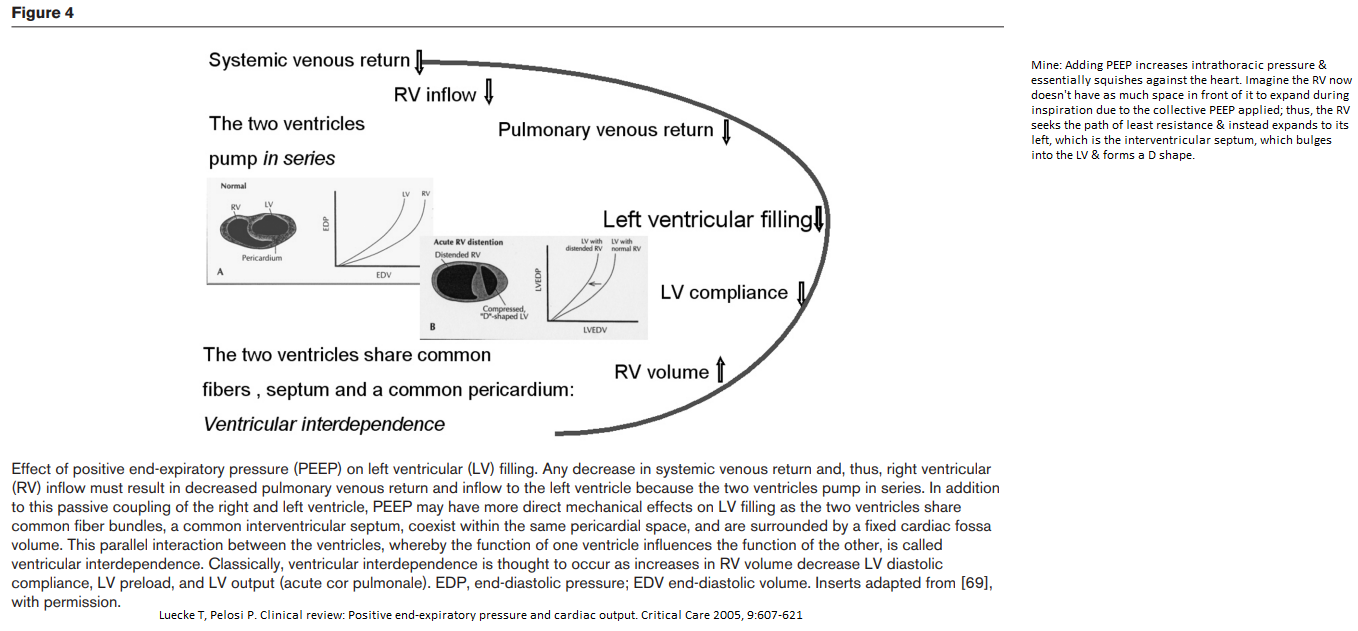
Mine: Adding PEEP increases intrathoracic pressure & essentially squishes against the heart. Imagine the RV now doesn't have as much space in front of it to expand during inspiration due to the collective PEEP applied; thus, the RV seeks the path of least resistance & instead expands to its left, which is the interventricular septum, which bulges into the LV & forms a D shape. This causes a decrease in the LV compliance.
Oxygen Consumption (VO2)
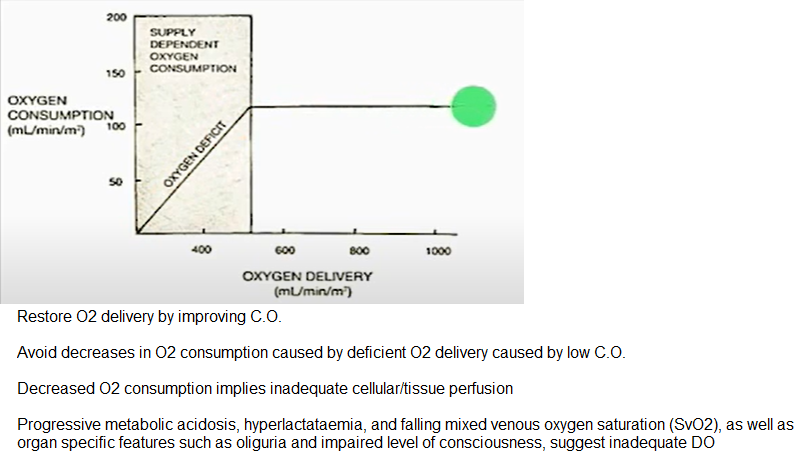
Restore O2 delivery by improving C.O.
Avoid decreases in O2 consumption caused by deficient O2 delivery caused by low C.O.
Decreased O2 consumption implies inadequate cellular/tissue perfusion
Video:
Fluid Resus in Severe Sepsis --Chad Meyers at 7:15
The amount of oxygen consumed (VO2) as a fraction of oxygen delivery (DO2) defines the oxygen extraction ratio (OER):
OER = VO2/DO2
In a normal 75 kg adult undertaking routine activities, VO2 is approximately 250 ml/min with an OER of 25% (fig 1), which increases to 70–80% during maximal exercise in the well trained athlete. The oxygen not extracted by the tissues returns to the lungs & the mixed venous saturation (SvO2) measured in the pulmonary artery represents the pooled venous saturation from all organs. It is influenced by changes in both global DO2 & VO2 and, provided the microcirculation and the mechanisms for cellular oxygen uptake are intact, a value above 70% indicates that global DO2 is adequate.
A mixed venous sample is necessary because the saturation of venous blood from different organs varies considerably. For example, the hepatic venous saturation is usually 40–50% but the renal venous saturation may exceed 80%, reflecting the considerable difference in the balance between the metabolic requirements of these organs and their individual oxygen deliveries. [Leach --Thorax 2002]
Pathologic supply dependent O2 consumption is an abnormal situation in which oxygen uptake (VO2) varies directly with oxygen delivery. See below.
Oxygen Delivery (DO2)
Progressive metabolic acidosis, hyperlactatemia, & falling mixed venous oxygen saturation (SvO2), as well as organ specific features such as oliguria & impaired level of consciousness, suggest inadequate DO2
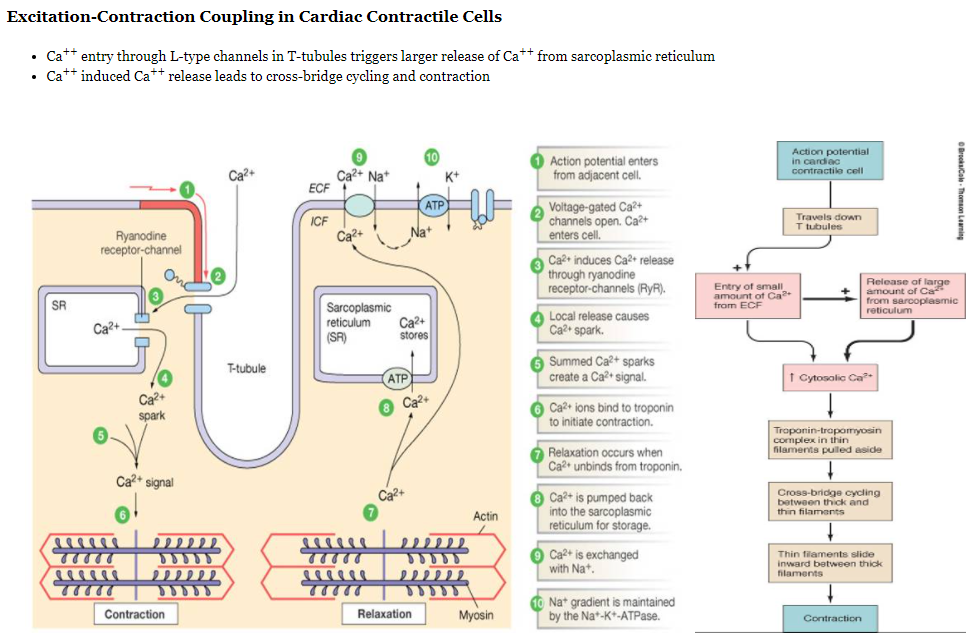
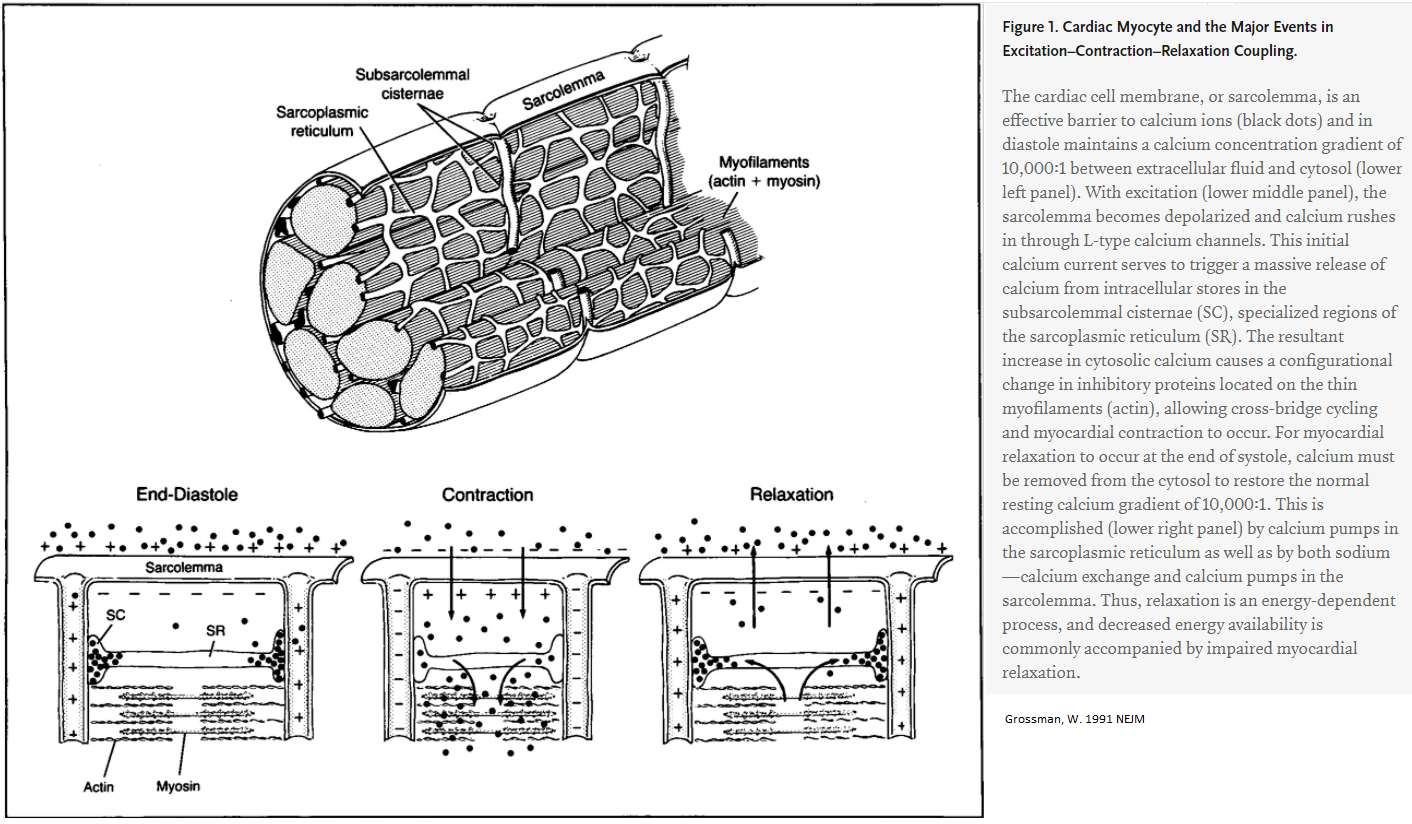
Contraction of Myocytes
Left-sided Heart Disease
pulmonary hypertension can arise due to left-sided heart disease.
Since the patient had no systolic or diastolic left heart disease or left-sided valvular disease on echocardiography, & the pulmonary-capillary wedge pressure was normal according to a right heart catheterization, left heart disease is unlikely.
Pulmonary HTN
Saukkonen K, et al. Case 9-2014 — A 34-Year-Old Woman with Increasing Dyspnea. March 20, 2014. N Engl J Med 2014; 370:1149-1157
AFTERLOAD
Afterload represents an impediment to ventricular output, with an increased LV afterload tending to reduce SVLV at a given preload. If intrathoracic pressure is increased, one might expect this pressure to compress the thoracic aorta, which would tend to increase LV afterload. Others suggest the opposite: increased intrathoracic pressure will displace blood from the thoracic to the abdominal aorta & decrease afterload. This is likely due to a relatively larger intrathoracic pressure compared with abdominal pressure & lower immediate transmural arterial pressures near the LV. (Verhoeff 2017)
Note: afterload = wall stress
PEEP
In contrast to its effect on the right ventricle, PEEP has been shown to decrease LV afterload. PEEP increases the pressure around structures in the thorax &, to a lesser extent, in the abdominal cavity, relative to atmospheric pressure.
Positive-pressure ventilation restricts the filling of the right ventricle because the elevated intrathoracic pressure (ITP) restricts venous flow into the thorax thereby reducing venous return & cardiac output.
Source:
Pulmonary Artery Wedge Pressure
Yogesh N. V. Reddy, MD1; Abdallah El-Sabbagh, MD1; Rick A. Nishimura, MD. Comparing Pulmonary Arterial Wedge Pressure and Left Ventricular End Diastolic Pressure for Assessment of Left-Sided Filling Pressures. JAMA Cardiol. 2018;3(6):453-454.
Hypertension
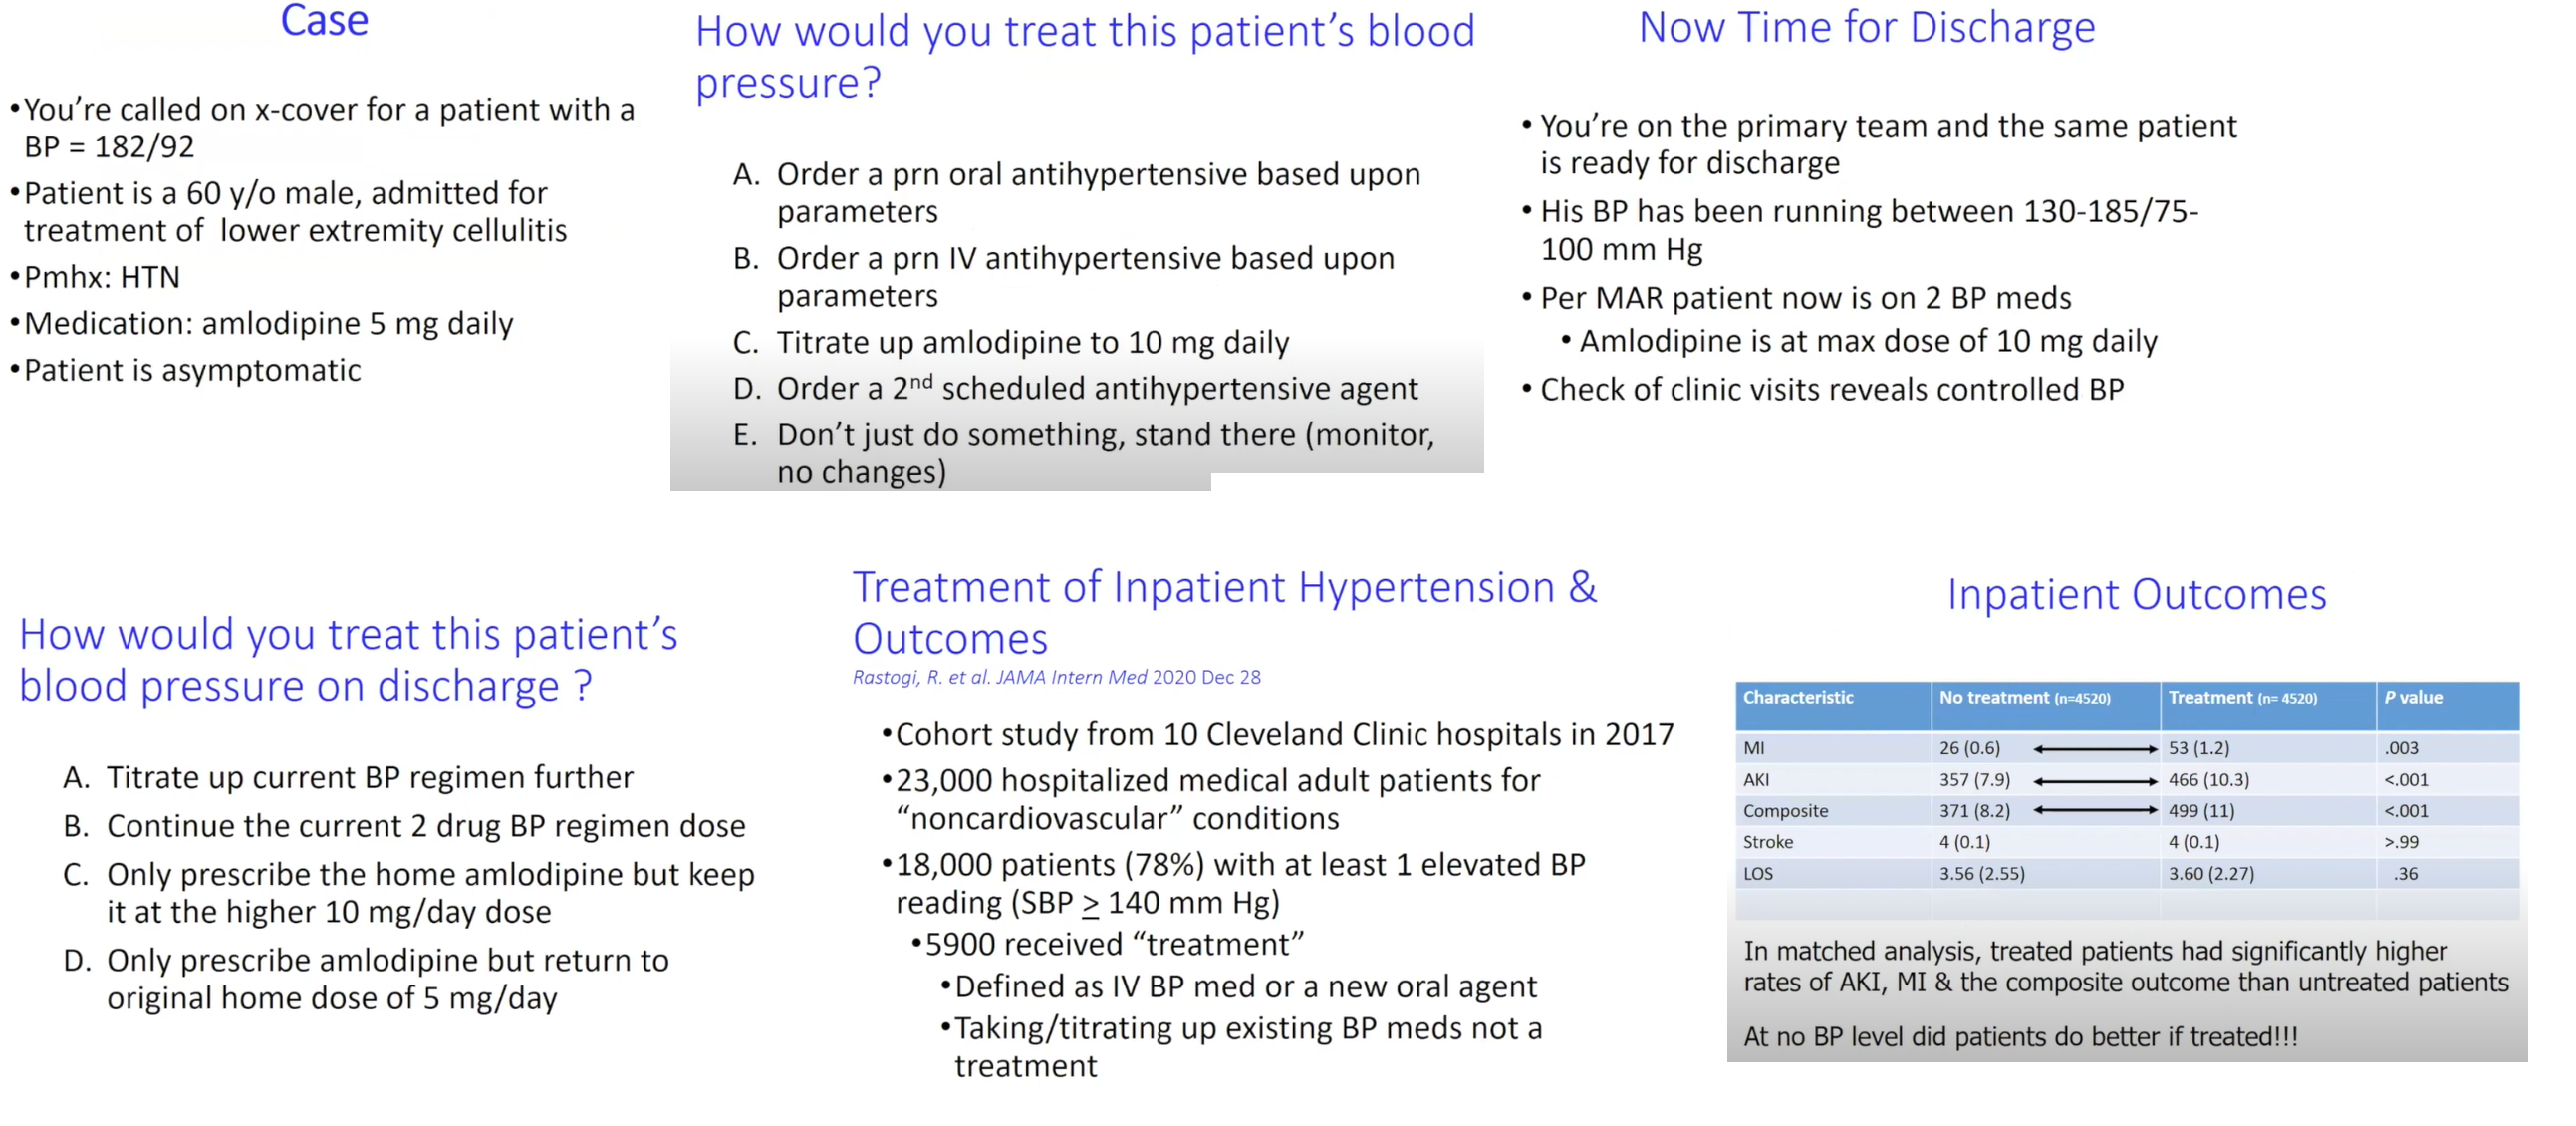
Ans: D above
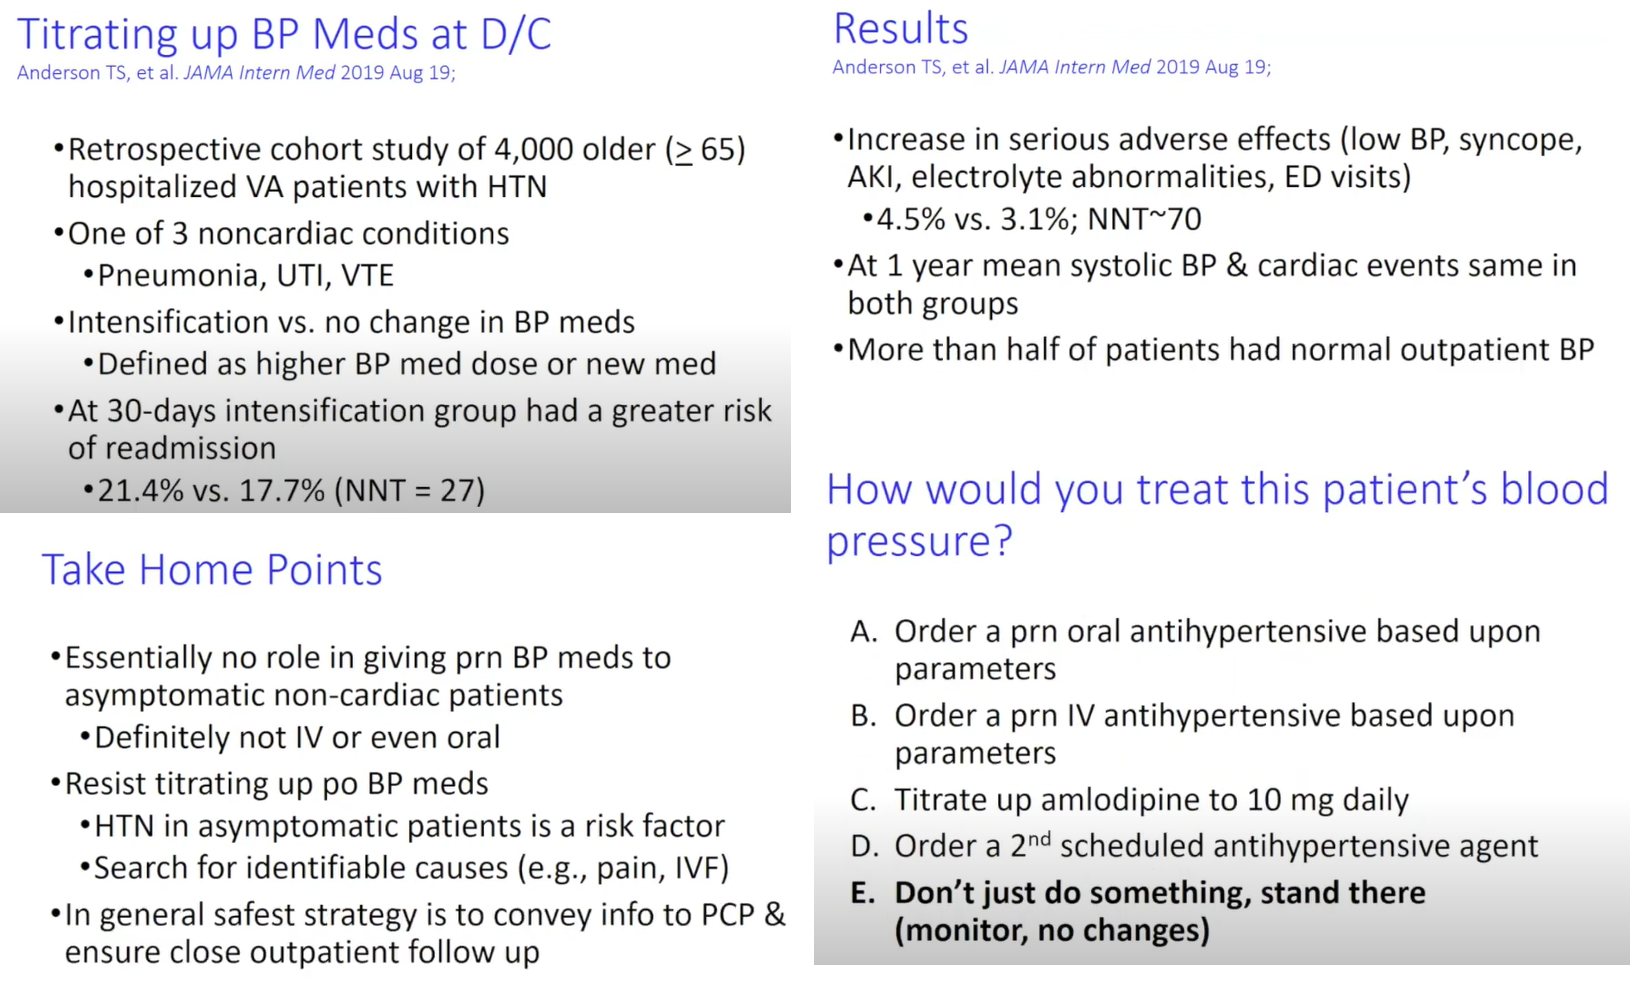
xxxxx
Preload
Preload = LVEDP or LVEDFL or LVEDV
= wall stress or wall tension at end-diastole.
Variables affecting preload:
When the myocardium becomes less compliant, any additional volume added to the LV will not result in more stretch of the myocardium, resulting in more pressure. If, however, the myocardium can still "stretch" to accommodate the extra volume, then the LV pressure would not have increased due to the expanded volume/ventricular space thru stretching of myocardial fibers.
Afterload
is the force opposing ventricular contraction during systole; ie, the mechanical load that the LV must eject blood against, sometimes defined as the wall stress or wall tension during systole --which allows for nice a parallel with preload as being the wall stress or wall tension at end-diastole.
Afterload is often used interchangeably with blood pressure or vascular resistance, but this is a significant oversimplification.
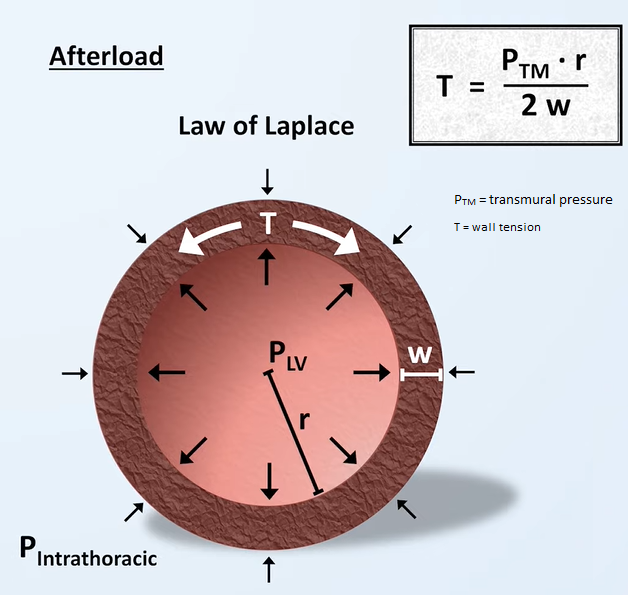
Afterload is INCREASED by:
Afterload is DECREASED by:
Sources:
Contractility
most clinically helpful to consider contractility to be the intrinsic strength of myocardial contraction that is independent of both preload & afterload. Under normal conditions, it is primarily influenced by the autonomic nervous system's regulation of cytosolic calcium.
Contractility is Increased by:
Contractility is Decreased by:
So why do we care about preload, afterload, contractility? We care because they are the determinants of stroke volume, which is the volume of blood ejected from the LV during systole. Stroke volume is related to the ejection fraction (EF), which is the percentage of blood in the LV that's ejected during systole. EF is clinically used as a semiquantitative surrogate for contractility & overall systolic function. These two values are calculated as such: Stroke volume equals end diastolic volume minus end systolic volume. EF as a percentage equals SV divided by EDV x 100. The normal range for EF is ~ 55-70%, though some references include 50-55% as normal, while others classify 50-55% as borderline.
How is the ejection fraction used in medicine?
Most prominently, it distinguishes different types of heart failure: specifically heart failure with preserved ejection fraction colloquially known as diastolic heart failure, and heart failure with reduced ejection fraction colloquially known as systolic heart failure.
EF guides mgmt in heart failure, specifically being one of the criteria for initiating certain medications such as beta blockers and aldosterone antagonists, & for placement of an implantable cardiodefibrillator. EF also guides the timing of valve replacement in valvular heart dz.
Related to management questions, it aids in prognostication in a variety of diseases, including heart failure and post-MI.
Another less common, but nevertheless important role of EF is monitoring for chemotherapy-related cardiotoxicity. However, there's a big asterisk when it comes to using the EF in these situations (see Frank Starling). There are many different ways to measure EF. The most common is echocardiography. With echo alone, there are multiple approaches to measuring EF, but the most conventional is the biplane method of disks. In this method, two different echo views are obtained. The apical 4 chamber view, in which the ultrasound probe is placed at the apex of the heart usually near the intersection of the midclavicular line and the 5th intercostal space. This provides one 2-dimensional view of the LV in systole &diastole. The ultrasound probe is then rotated 90 degrees to acquire another view of the LV in systole & diastole. Tracings of the LV cavity are divided into a predetermined number of section usually 20, and using the 2 different views, the LV cavity is then subdivided into a stack of ellipsoid disks at end-systole and end-diastole, whose individual volumes can be added to provide end systolic & end diastole volumes, from which EF is calculated. There are many different variations on this method, all of which need to strike a balance between making as few assumptions about LV shape as possible, while making the image acquisition as practical as possible. In addition to assumptions about LV shape, there is some subjectivity involved in manually tracing the LV cavity, particularly when image quality is poor due to factors like obesity, or relative immobility of the patient.
---
In addition to challenges with accurately measuring EF, there's also a problem with using it as a surrogate for overall systolic function in pts with valvular dz. For example, consider a pt whose EDV is 110 mL, and ESV is 50 mL. This makes their stroke volume 60 mL, & their EF 60 divided by 110, or 55% - which is normal. But what if pt has severe mitral regurgitation a condition in which their mitral valve is incompetent & allows the backwards movement of blood from the LV to the LA during systole. If 1/3 of their ejected volume moves backwards, the effective SV is only 40mL. This would suggest that the conventionally calculated EF of 55%, if used as a surrogate for overall cardiac function, is an overestimate. Framed a little differently, in a patient with severe mitral regurgitation and otherwise normal cardiac function, we would expect a higher than normal ejection fraction as the low pressure of the left atrium significantly reduces afterload. The same general problem is present for patients with aortic regurgitation, in which significant volume of blood falls backwards from the aorta into the LV during diastole. That regurgitating blood counts as part of the SV, even though it doesn't immediately enter the systemic circulation.
---
A quantifiable physiologic parameter of overall cardiac function whose measurement does not suffer from these same limitations is cardiac output. The cardiac output is the volume of blood ejected forward from the heart per unit time. It is usually reported in liters per minute, and is sometimes abbreviated Q which is a common abbreviation in physics for fluid flow. In order to correct for differences in body size so that cardiac outputs can be compared to a reference standard, we use the cardiac index, which is the cardiac output adjusted for estimated body surface area. Cardiac index is reported in liters per min per meter squared. Mathematically, the cardiac output is the SV times the HR. In other words, the blood ejected from the ventricle with each contraction, times the number of contractions per minute. And cardiac index is just cardiac output divided by the body surface area. A normal cardiac index is 2.5 to 4.0. However, physicians do not typically calculate the cardiac output and index this way in real-life clinical situations, because as we saw with measuring ejection fraction, measuring stroke volume can involve a lot of assumptions, and is practically impossible to do for patients with irregular rhythms. So instead, there are a number of interesting techniques to measure cardiac output. They fall into invasive (or traditional) vs. non-invasive categories. All of them have advantages and disadvantages. As a general rule, the invasive techniques are considered more accurate, while some non-invasive techniques can provide real time, continuous cardiac output monitoring. Which technique is used for a particular patient depends on the patient and the physician, but is probably most dependent on ward and institution level preferences for example, a particular cardiac care unit might only measure cardiac output using the Fick method, while an ICU in the same hospital may have fully transitioned to non-invasive techniques only.
I'll briefly discuss the invasive techniques since these are still relatively common in the US. The historically first described technique was pretty much the standard when I was a student: the Fick method. Conceptually, the Fick method is based on the principle of conservation of mass. Specifically, the amount of oxygen leaving the lungs via the pulmonary veins & ultimately the amount in the systemic arteries is equal to the amount of oxygen returning from the body via the pulmonary arteries plus oxygen added from ventilation. This oxygen added via ventilation is the oxygen that is consumed by the body's tissues. The calculation for this is cardiac output times the O2 content of mixed venous blood that is, blood from the right ventricle or preferably pulmonary artery that s been fully mixed since the O2 content in blood returning via the IVC and SVC are not necessarily the same, plus O2 consumption equals the cardiac output times the O2 content of arterial blood. With some quick algebraic rearrangement, we get this. And O2 content of blood is approximately equal to the hemoglobin times the O2 saturation times a correction factor, which gives us the final practical form of the calculation. So to calculate cardiac output, we need to know the patient s hemoglobin, and their venous and arterial O2 sats all of which are easily measured at the bedside. But wait: you re probably also wondering about that O2 consumption variable. Well that s the main problem with the Fick method directly measuring O2 consumption can be done using equipment colloquially referred to as a metabolic cart, but in practice this is not common, and physicians often make educated guesses about O2 consumption from published nomograms, which may or may not apply well to their specific patient. Another disadvantage is the need for an invasive measurement of venous O2 sat using a central venous catheter preferably a pulmonary artery catheter which can measure true mixed venous O2.
The second invasive technique is thermodilution. Thermodilution requires a pulmonary artery catheter with a thermistor at the distal end. A thermistor is a resistance thermometer, or a resistor whose resistance is dependent on temperature. So in another words, it can very rapidly measure changes in temperature in real time. A small amount of relatively cold saline solution of precisely known temperature and volume is injected from the proximal port of the catheter, located in the right atrium. And the thermistor records the change in temperature that it experiences as the cold fluid passes by it while diffusing and mixing with the surrounding warm blood. This generates a curve of change in temperature as a function of time, in which the cardiac output in inversely proportional to the area under that curve. This is done automatically by a computer there is no need for physician to do calculus at the bedside. For a patient with low cardiac output, it takes longer for that cooled blood to make its way completely past the thermistor, resulting in a wider curve. Disadvantages of thermodilution include that it also requires an invasive pulmonary artery catheter, and it's not accurate in the setting of intracardiac shunts and tricuspid regurgitation.
---
The Frank Starling mechanism, also known as the Frank Staling relationship, Frank-Starling Law, and when illustrated as a graph, as the Frank-Starling curve is the observation that the SV is dependent on LVEDV. At low and normal volumes, stroke volume increases with increasing volume. This is a critically important autoregulatory mechanism that accounts for things like the moment to moment changes in preload secondary to the respiratory cycle or to abrupt changes in position. It allows the stroke volume from the right and left ventricles to match each other, even if pathology is present that asymmetrically affects one ventricle more than the other.
In patients who experience a brief interruption in their cardiac rhythm, for example from a premature depolarization that fails to produce contraction, the subsequent unusually long ventricular diastole will result in an unusually high amount of diastolic filling which would be a problem if the stroke volume couldn't immediately increase with the next ventricular contraction. When people experience palpitations related to premature beats, it's usually not the actual premature depolarization that they sense, but rather the post-pause accentuation of stroke volume that leads to a single, unusually strong pulse beat.
---
However, there is a limit to this mechanism. As you can see from the graph, as the LVEDV increases into the higher than normal range, the increase in stroke volume becomes less and less, until the curve flattens. Contractility plays an important role in the Frank Starling mechanism. In patients whose contractility is increased, for example, by activation of the sympathetic nervous system, or by administration of positive inotropic medications, this curve shifts upwards so that stroke volume is increased at any given volume, and it takes higher volumes to reach the flat part of the curve. And for patients whose contractility is decreased, for example, due to ischemia, heart failure, or metabolic derangements, the curve is shifted downward, the plateau is seen at lower volumes, and in some cases, stroke volume may even decrease at extreme end diastolic volumes. There have been multiple hypotheses as to the molecular basis for the Frank Starling mechanism, but they are as-of-yet unproven. The current working hypothesis is that physical stretching of the myofibrils somehow increases their sensitivity to calcium. Some of you may already be correctly speculating that the stroke volume end diastolic volume relationship is dependent not only on contractility, but it s also dependent on afterload as well afterload is literally defined as the total mechanical force that is opposing ventricular contraction, so naturally, higher afterload will shift this curve downward and lower afterload will shift it upward.
The last point to make here is that the ejection fraction is also dependent on LVEDV. Remember how EF is calculated it s the stroke volume divided by the end diastolic volume. When the curve starts to flatten, it means the stroke volume is no longer increasing with increasing end diastolic volume, so EF will necessarily decrease, even if contractility & afterload remain unchanged. This fact is very frequently but inappropriately ignored when monitoring a patient s response to heart failure management. If between two points in time, the EF in a patient with heart failure increased 5%, does that mean that their chronic heart failure treatment is working, or is that just because the patient skipped their usual salt-laden breakfast the day of the second measurement? And for that matter, just like the effect of afterload on stroke volume, afterload affects EF too. So a patient who forgot to take their medications the morning of their echo could have their EF measured as lower than it normally would be, These are some of the reasons that EF should not be used as the primary metric for monitoring heart failure.
---
Let me summarize. Preload can be defined as either the LV wall tension or LV sarcomere length at end-diastole. Afterload is the force opposing ventricular contraction during systole. And contractility is the intrinsic strength of myocardial contraction that is independent of both preload and afterload. As mentioned earlier, these are not necessarily consensus definitions, and not every physiologist and clinician uses the words in precisely the same way. With preload, afterload, and contractility, none of these 3 are directly measured in routine clinical practice. However, there are common, convenient, and imprecise bedside surrogates used. For preload, clinicians often use central venous pressure, as measured via a central venous catheter in the right atrium or as estimated on exam using the jugular vein. For afterload, they use systemic vascular resistance, or if being unusually imprecise, plain old systolic blood pressure. And for contractility, they use the ejection fraction. All of these surrogates, particularly EF, should be applied with caution. Despite just talking about the problems with oversimplifying these complex physiologic
principles, let me give you an oversimplified analogy for them. Imagine a slingshot. How
far the band is stretched just before letting go is analogous to preload. The mass of the
rock is analogous to afterload. And the intrinsic recoil of the band, that characteristic that
is independent of the degree of stretch, is analogous to contractility. How far the rock
ultimately travels is sort of like the stroke volume. So the further the band is stretched
and the more recoil it has, and the less massive the rock is, the farther the rock will travel
when released. Hopefully no physiologists will throw rocks
at me with that analogy.
The 4 equations that you need to remember: the calculation of stroke volume, ejection
fraction, cardiac output, and cardiac index.
And last, the Frank-Starling curve illustrates the non-linear relationship between LVEDV
and stroke volume.
Critical Closing Pressure
Critical closing pressure: pressure at which a blood vessel collapses & blood flow stops
Laplace’s Law: The force acting on blood vessel wall is proportional to the diameter of the vessel x the BP
F = D x P so, as diameter of a vessel increases, force on the wall increases
Vascular compliance: tendency for blood vessel volume to increase as BP increases; how easily a blood vessel wall stretches
Compliance: change in volume/change in pressure
The more easily a vessel wall stretches, the greater its compliance
Venous system has a large compliance (24 times greater than that of arteries) & acts as a blood reservoir. This is why there is more blood in the veins than in the arteries.
Autoregulation
Under extreme conditions, when MAP gets too low, blood flow depends on perfusion pressure
However, under normal conditions, changing perfusion pressures won't affect blood flow.
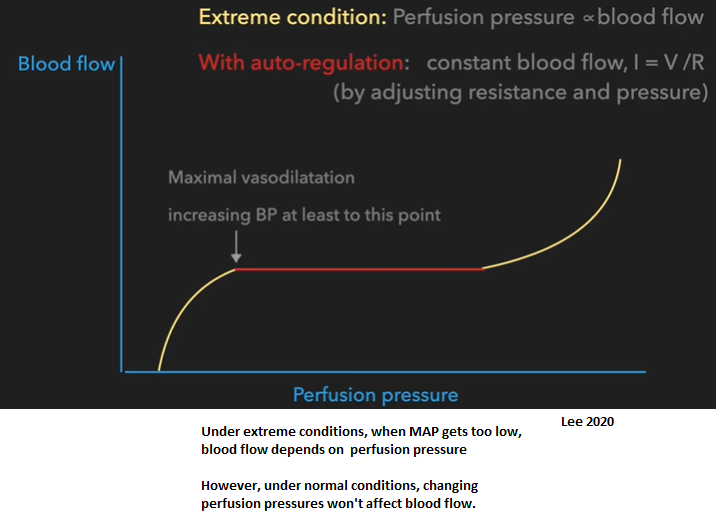
Reason to use vasopressors to increase MAP? To reach a BP (MAP) where pt can restore autoregulation so organs can maintain constant blood flow.
Vascular Waterfall
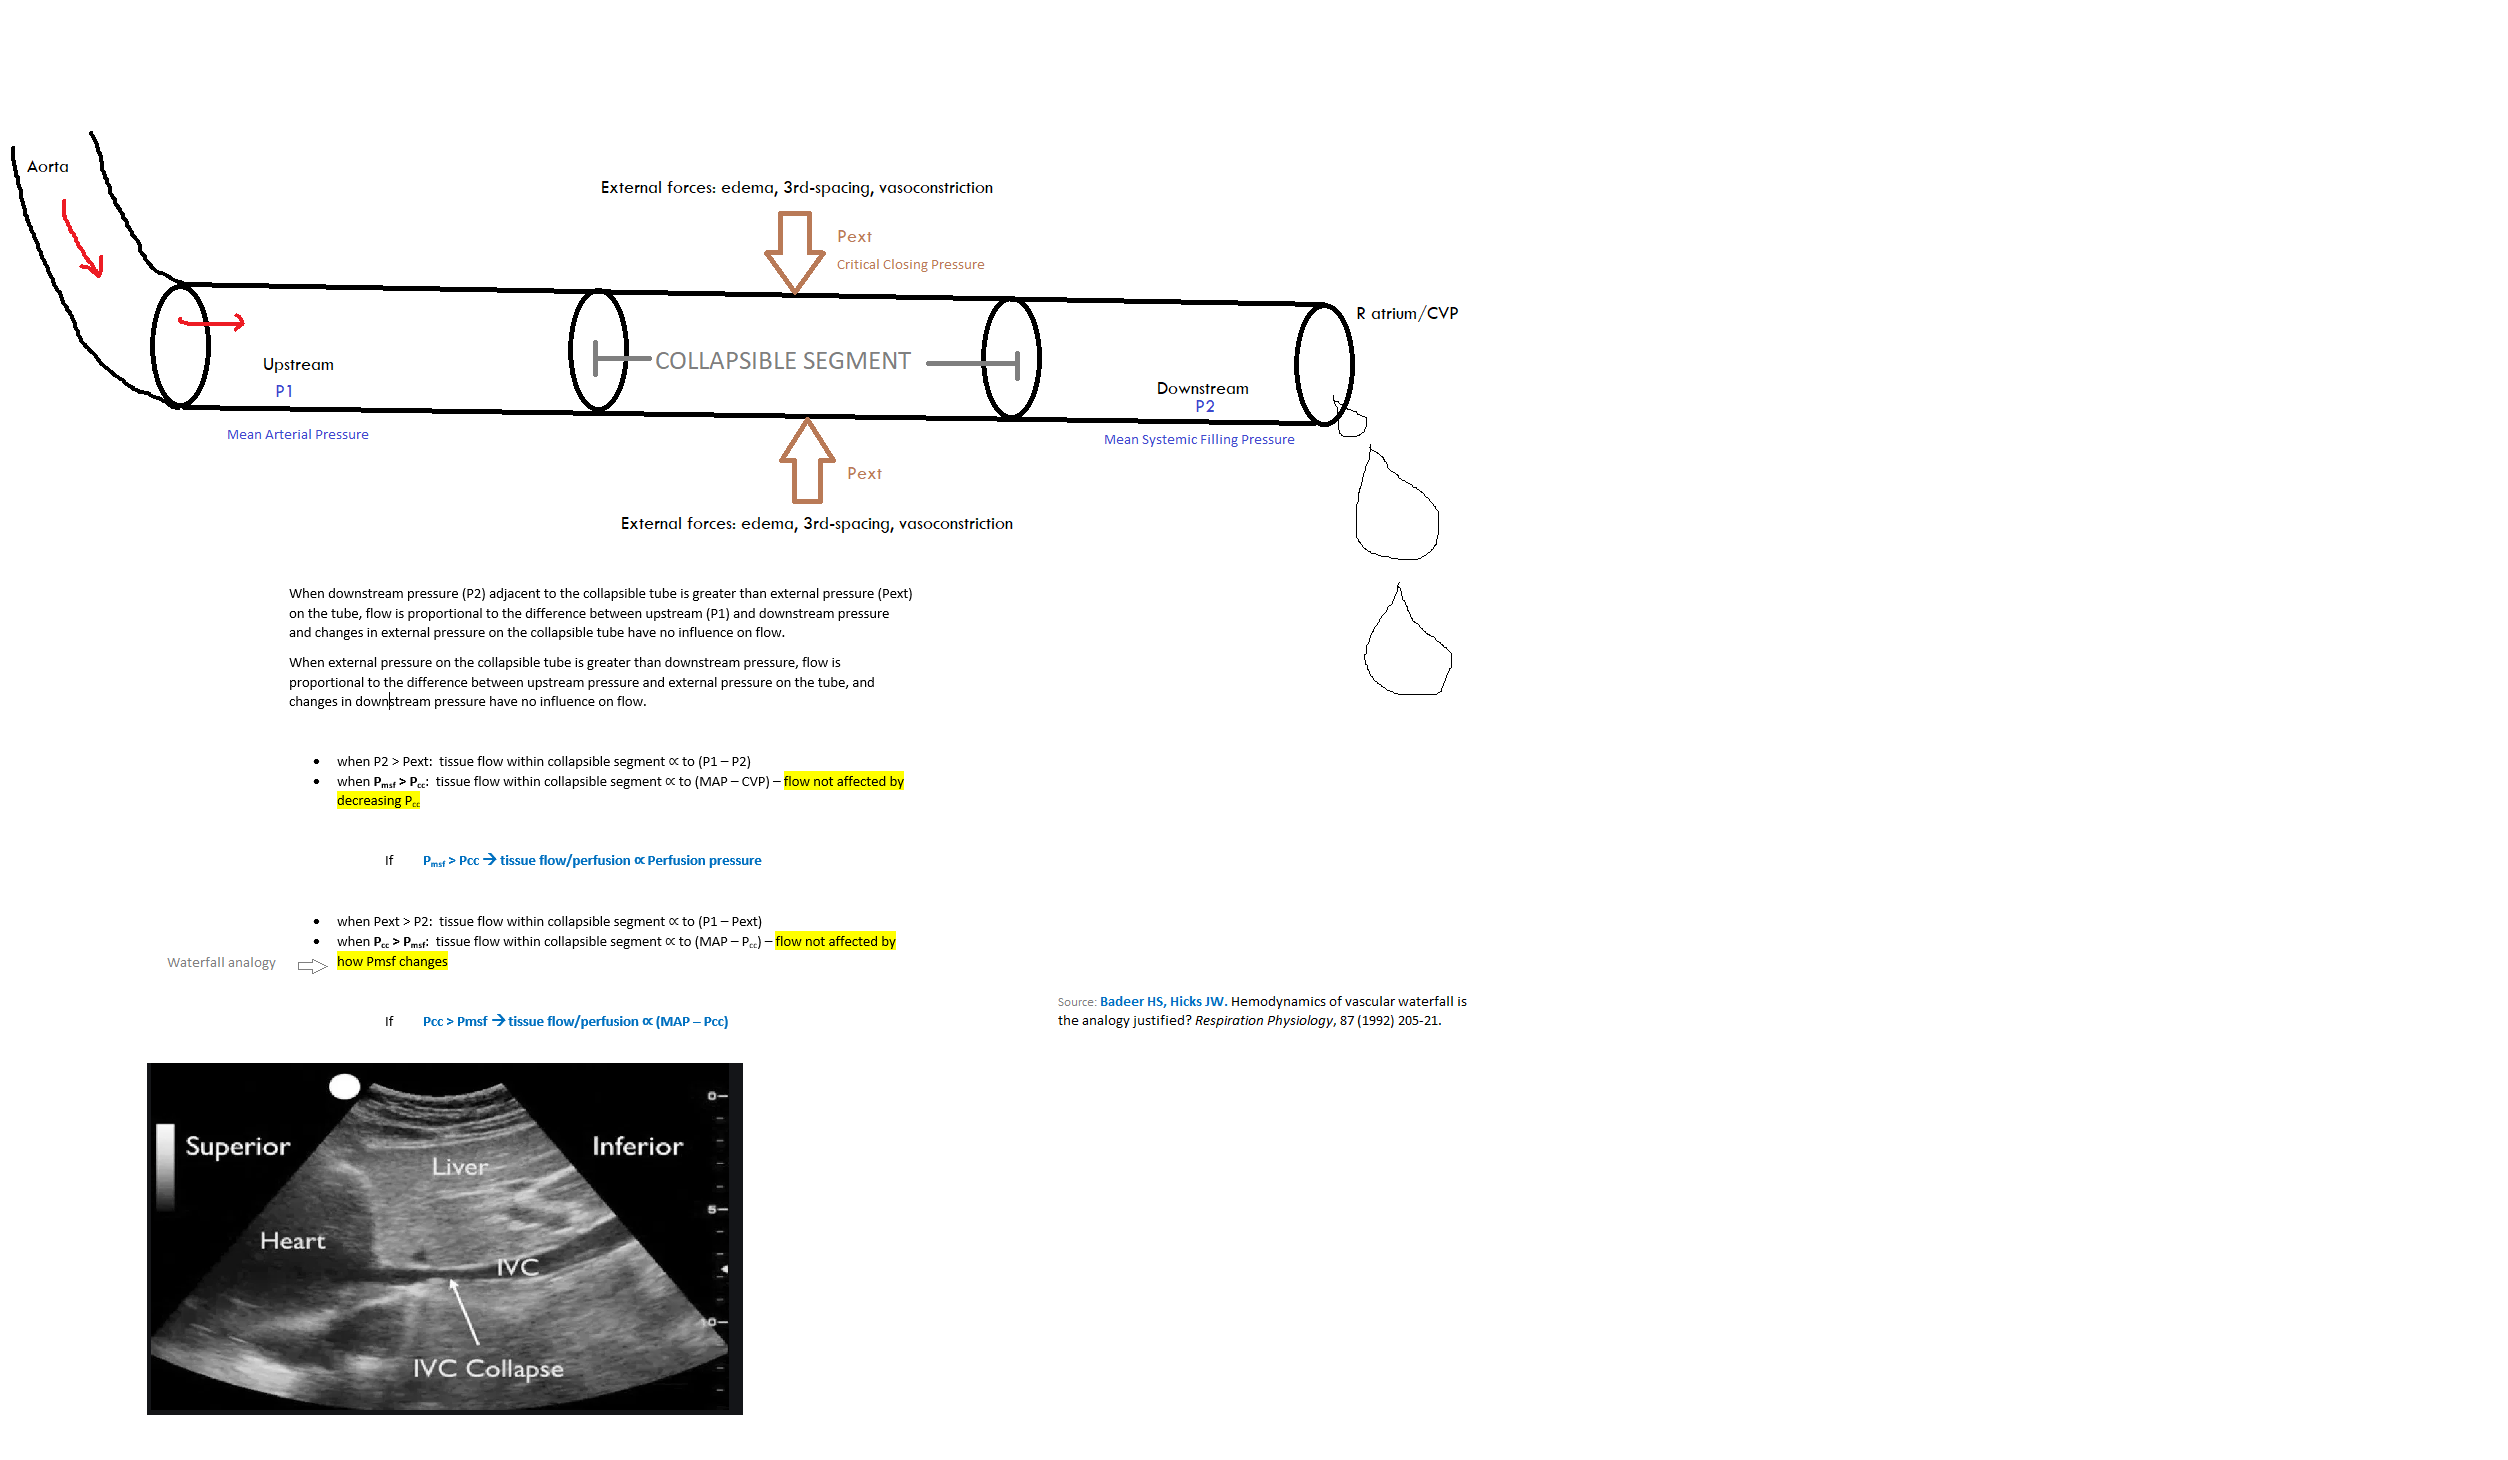
A vascular waterfall occurs when the critical closing pressure > mean systemic filling pressure. This is the normal state.
View my video explaining this concept here
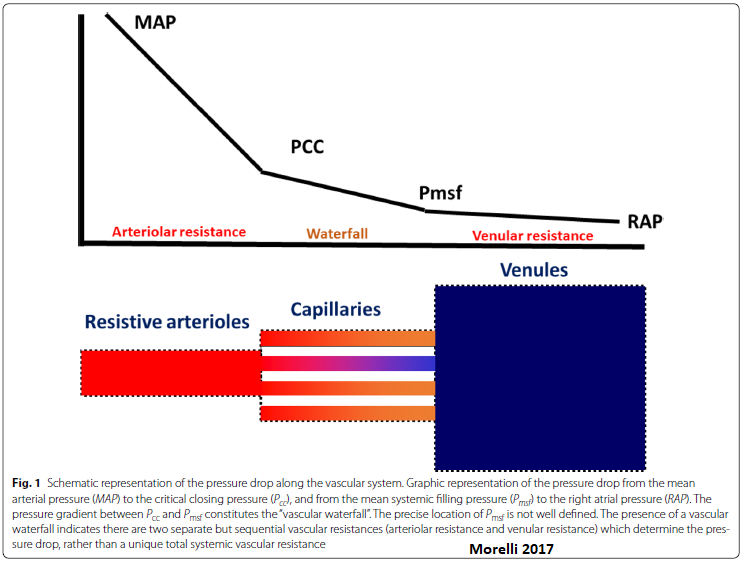
Organ perfusion pressure = inflow pressure - outflow pressure.
In a totally vasodilated vasculature, outflow pressure approximates local venous pressure. MAP is usually considered to be the inflow pressure.
Under some conditions, the driving pressure for the flow through arterioles is not the difference between the inflow pressure & outflow pressure of the arterioles, but rather the difference between the inflow pressure & the critical closing pressure. This seemingly slight modification causes marked differences in the interpretation of pressure-flow relationships & vascular resistance in the presence of active tone.
Because the waterfall phenomenon likely exists in the microcirculation, β1-receptor blockers such as esmolol could have some effect on microcirculation and vascular waterfall.
What pressure difference drives organ blood flow? Depends. . .
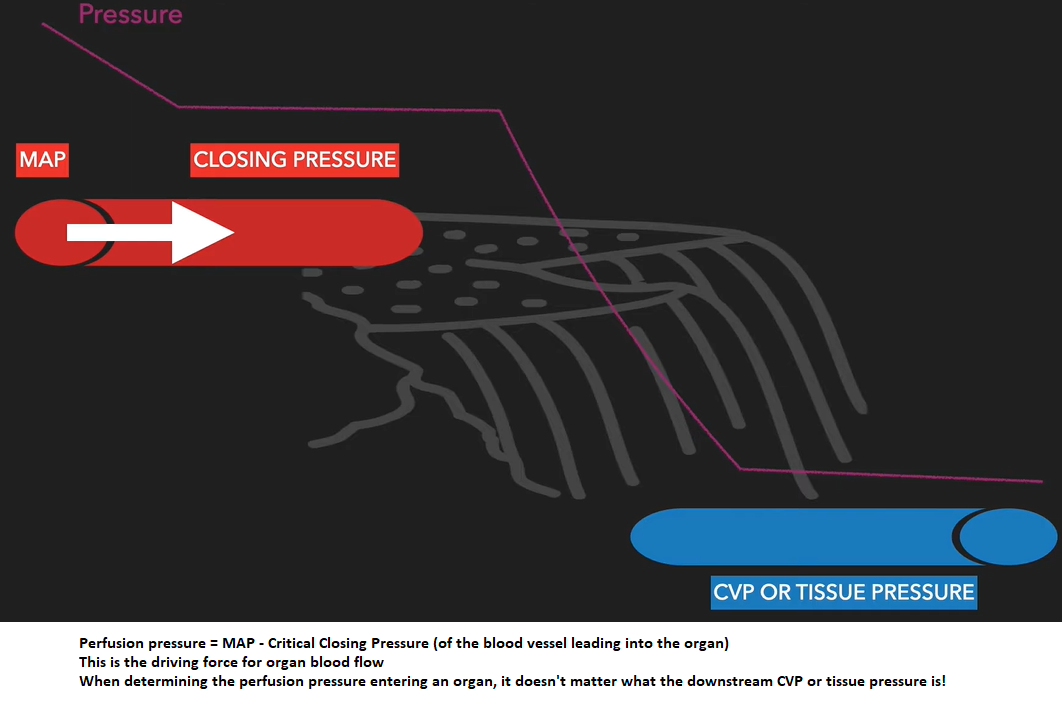
Under normal conditions with preservation of auto regulation: MAP - Closing pressure (of the blood vessel)
Under profound hypotension with loss of autoregulation: MAP – (“tissue” or CVP)
In contrast to acute low flow states in which MAP decreases & Pcc remains unaffected, the massive loss of smooth muscle tone in sepsis decreases both MAP & Pcc. The Pcc may thus become equal to the downstream pressure (Pmsf), rendering the vascular waterfall ineffective. When MAP is below the autoregulation threshold & the vascular waterfall is eliminated, tissue perfusion becomes solely dependent on perfusion pressure & thus MAP. If the vascular waterfall is absent, an increase in RAP may further worsen capillary perfusion. Vasopressor agents increase MAP but the effect on Pcc remains to be better elucidated. Increasing MAP above the autoregulatory threshold in septic pts with microcirculatory impairment have variable effects on microvascular perfusion.
So, under normal conditions, when determining the perfusion pressure entering an organ, it doesn't matter what the downstream CVP or tissue pressure is!
Video: Shock physiology: 2.Perfusion pressure (English version) C.C. Lee
Sources:
Du W, et al. The β-Blocker Esmolol Restores the Vascular Waterfall Phenomenon After Acute Endotoxemia. Crit Care Med. 2017 Dec;45(12):e1247-e1253.
Morelli A, et al. Intensive Care Med. Heidelberg Vol. 44, Iss. 6, (Jun 2018): 911-914.

Critical closing pressure
Resistance to flow through a tube is calculated as the difference between the upstream and downstream pressures, divided by the flow between the two pressures. Accordingly, systemic vascular resistance typically is calculated as the difference between aortic mean pressure and the right atrial pressure, or central venous pressure, which usually are the same. This calculation assumes that the vascular system functions as a continuous tube, but this is not true. Most tissues have critical closing pressures at the level of the arterioles. These are also called vascular waterfalls or Starling resistors. The presence of a critical closing pressure creates the same phenomena that exist in veins when the pressure inside a vessel is less than the pressure outside, but in arterioles flow limitation likely is created by the flow characteristics in small vessels without true collapse. When waterfall-like properties exist, the downstream pressure no longer effects flow, and arterial resistance should be calculated from mean arterial pressure to the critical closing pressure, and not to the right atrial pressure. Animal studies suggest that the average critical closing pressure for the whole circulation is around 30 mmHg but the critical closing pressure differs among vascular beds. For example, in resting skeletal muscle the critical closing pressure was estimated to be over 60 mmHg. In the coronary circulation the critical closing pressure likely is in the range of 15 to 25 mmHg under baseline conditions. Unfortunately, mean arterial critical closing pressure currently cannot be assessed in an intact person either for the whole body or in local regions.
When a critical closing pressure is present, use of the right atrial or central venous pressure as the value of downstream pressure for the vasculature produces an important error in the common assessment of vascular resistance.
Flow & Cardiac Output
I = V/R
Blood flow = Pressure gradient/Arterial resistance
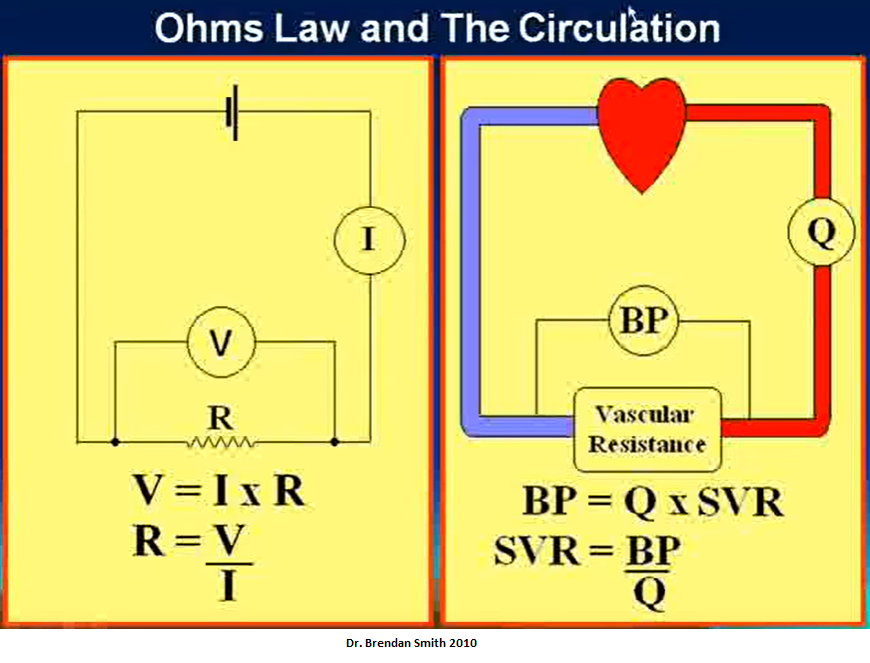
Video explaining above
Source: Hemodynamics Introduction - part 1 of 5 Dr. Brendan Smith
The 4 equations that you need to remember: the calculation of stroke volume, ejection fraction, cardiac output, and cardiac index.
And last, the Frank-Starling curve illustrates the non-linear relationship between LVEDV and stroke volume.
Filling Pressures
Essentially, the pressures required to fill the ventricles during diastole--mine.
In the normal cardiovascular system at rest, pressures in the pulmonary artery, left atrium & LV are essentially equal at end-diastole. PAEDP = LAEDP = LVEDP
LVEDP is the best pressure to use in the assessment of LV function. Mean LAP is the best pressure to use when the aim is to determine the presence of a tendency to pulmonary congestion or the possibility of post capillary pulmonary hypertension.
Source: Peverill R. “Left ventricular filling pressure(s)” — Ambiguous and misleading terminology, best abandoned. International Journal of Cardiology 191 (2015) 110–113.
Filling pressure Definition. The pressure that builds up in the ventricle as the ventricle is being filled with blood, typically equivalent to the mean atrial pressure in the absence of A-V valvular gradient.
Preload is the filling pressure of the heart at the end of diastole. The left atrial pressure (LAP) at the end of diastole will determine the preload. The greater the preload, the greater will be the volume of blood in the heart at the end of diastole.
Elevated filling pressures are the main physiologic consequence of diastolic dysfunction. Filling pressures are considered elevated when the mean pulmonary capillary wedge pressure (PCWP) is >12 mm Hg or when the LVEDP is >16 mm Hg. Filling pressures change minimally with exercise in healthy subjects.
However, the presence of normal EF does not exclude a cardiac etiology for dyspnea, as ~ 50% of pts with HF have only mildly reduced EF or preserved EF (heart failure with preserved ejection fraction [HFpEF]). A diagnostic hallmark of HF is elevated LV filling pressure, a compensatory response to maintain cardiac output that is observed regardless of LVEF.
Information about filling pressure is important not only to diagnose HF, but also to better appreciate its severity &, subsequently, the response to treatment.
Low left atrial pressure, particularly with low right atrial pressure (CVP), is suggestive of volume depletion, whereas high left atrial pressure is suggestive of left ventricular dysfunction, volume overload, tamponade, or mitral valve regurgitation.
LV filling pressure or pulmonary capillary wedge pressure (PCWP).
In contrast to the recommendation to avoid β-blockade during pulmonary edema, β-blockers are strongly recommended before hospital discharge for secondary prevention of cardiac events. The initial dose and titration should be based on clinical heart failure status & LVEF.
LV filling pressures may rapidly rise after acute coronary occlusion. This leads to rapid redistribution of fluid from the intravascular space into the lung interstitium & alveoli.
In both systolic & diastolic heart failure, RV filling pressure, ie, right atrial pressure (RAP) is significantly correlated to LV filling pressure, ie, pulmonary capillary wedge pressure (PCWP).
Definition of Left Ventricular Filling Pressure
Several pressure measurements are collectively referred to as filling pressures. They include mean left atrial pressure (LAP), mean pulmonary capillary wedge pressure (PCWP) as a corollary of LAP, & LV end diastolic pressure (LVEDP). In addition, diastolic LV pressure (LVP) prior to atrial contraction has been shown to relate closely with mean LAP. It is important, however, to understand the clinical difference between mean LAP (or PCWP) & LVEDP. Although a high LVEDP is indicative of increased LV stiffness at end diastole, many of these pts have normal diastolic LVP prior to atrial contraction, & consequently a normal mean LAP. Therefore, when evaluating pts with dyspnea, it is preferable to utilize indices that provide an estimate of mean LAP rather than LVEDP.
https://thoracickey.com/evaluation-of-intracardiac-filling-pressures/
An alternative to estimating the end-diastolic volume of the heart is to measure the end-diastolic pressure. This is possible because pressure & volume are related to one another according to Boyle's law, which can be simplified to
P
∝
1
V
{\displaystyle P\propto {\frac {1}{V}}}
<img src="https://wikimedia.org/api/rest_v1/media/math/render/svg/36e185ae17420ddc45220bfc1572201e27f4131d" class="mwe-math-fallback-image-inline" aria-hidden="true" style="vertical-align: -2.005ex; width:7.467ex; height:5.343ex;" alt="P\propto {\frac {1}{V}}">
The end diastolic pressure of the RV can measured directly with a Swan-Ganz catheter. For the LV, end diastolic pressure is most commonly estimated by taking the pulmonary wedge pressure, which is approximately equal to the pressure in the LA when the lungs are healthy. When the heart is healthy the diastolic pressure in the LA & LV are equal. When both the heart & lungs are healthy, pulmonary wedge pressure is equal to LV diastolic pressure & can be used as a surrogate for preload. Pulmonary wedge pressure will overestimate LV pressure in people with mitral valve stenosis, pulmonary HTN & other heart and lung conditions.
Estimation of preload may also be inaccurate in a chronically dilated ventricles because additional new sarcomeres cause the relaxed ventricle to appear enlarged.
https://en.m.wikipedia.org/wiki/Preload_(cardiology)
Pulse Pressure
Pulse pressure is a good indicator of which of the following? Cardiac output.
Pulse pressure is the difference between your systolic BP & diastolic BP. For example, if your systolic BP is 110 mm Hg & your diastolic BP is 80 mm Hg, then your pulse pressure would be 30 mm Hg.
The systolic BP is defined as the maximum pressure experienced in the aorta when the heart contracts & ejects blood into the aorta from the LV (~120 mmHg). The diastolic BP is the minimum pressure experienced in the aorta when the heart is relaxing before ejecting blood into the aorta from the LV (~80 mmHg). Normal pulse pressure is, therefore, ~40 mmHg.
A pulse pressure that is < 25% of the systolic pressure is inappropriately low or narrowed, whereas a pulse pressure of > 100 is high or widened.
The research done by Blacher et al. has shown that pulse pressure is a significant risk factor in the development of heart dz. It has even been shown to be more of a determinant than the mean arterial pressure, which is the average BP that a pt experiences in a single cardiac cycle. In fact, as little as a 10 mmHg increase in the pulse pressure increases the cardiovascular risk by as much as 20%.
In fact, for every 20 mmHg increase in pulse pressure, the adjusted hazard ratio for developing atrial fibrillation is 1.28. This risk is independent of mean arterial pressure.
A change in pulse pressure (delta Pp) is proportional to volume change (delta-V) but inversely proportional to arterial compliance (C):
Delta Pp = Delta V/C
Because the change in volume is due to the stroke volume of blood ejected from the left ventricle (SV), we can approximate pulse pressure as:
Pp = SV/C
A normal young adult at rest has a stroke volume of approximately 80 mL. Arterial compliance is ~ 2 mL/mm Hg, which confirms that normal pulse pressure is ~ 40 mm Hg.
Arterial compliance is equal to the change in volume (Delta V) over a given change in pressure (Delta P):
C = Delta V/Delta P
Because the aorta is the most compliant portion of the human arterial system, the pulse pressure is the lowest. Compliance progressively decreases until it reaches a minimum in the femoral & saphenous arteries, & then it begins to increase again. This concept requires an understanding of the effect of pressure wave reflection on the amplification of aortic pressure & thus pulse pressure. The phenomenon mainly occurs in the lower body, especially the lower extremities where pressure waves reflect back due to vessel branching, & the vessels are less compliant (stiffer) When a reflected wave is in phase with a forward wave, it generates a wave with higher amplitude. An analogy here is waves bouncing off a seawall & interacting with an incoming wave. If they are in phase, the wave height is greater.
Pathophysiology
An increase in pulse pressure can occur in a well-conditioned endurance runner. As he or she continues to exercise, the systolic pressure will progressively increase due to an increase in stroke volume & cardiac output. Diastolic pressure, on the contrary, will continually decrease due to a decrease in the total peripheral resistance. This effect is due to the accumulation of red (slow-twitch) muscle tissue in the arterioles instead of white (fast-twitch) tissue. As a result, the pulse pressure is going to increase; this can also occur in individuals with larger amounts of muscle mass.
Aging impacts pulse pressure & arterial compliance. With aging, there is a decrease in the compliance of the large elastic arteries. This change is due to structural molecular changes in the arterial wall, including decreased elastin content, increased collagen I deposition, and calcification, which increases the stiffness of the wall. This process is often described as "hardening of the arteries." As the left ventricle contracts against stiffer, less compliant arteries, systolic and diastolic pressures increase and can result in a widened pulse pressure. In response, the left ventricular tend to hypertrophy. When excessive pulse pressure transmits through the microcirculation of vital organs such as the brain and kidneys, extensive tissue damage tends to occur.
A widened (or larger) pulse pressure occurs with several diseases, including aortic regurgitation, aortic sclerosis (both heart valve conditions), severe iron deficiency anemia (reduced blood viscosity), arteriosclerosis (less compliant arteries), & hyperthyroidism (increased systolic pressure). In the majority of these cases, systolic pressures increase while diastolic pressures remain near normal. In aortic regurgitation, the aortic valve insufficiency results in a backward, or regurgitant flow of blood from the aorta back into the left ventricle, so that blood ejected during systole returns during diastole. This condition leads to an increase in the systolic pressure and a decrease in the diastolic pressure, which results in increased pulse pressure. In aortic stenosis, there is a narrowing of the aortic valve, which interferes with the ejection of blood from the left ventricle into the aorta, which results in a decrease in stroke volume and a subsequent decrease in pulse pressure.
Narrow pulse pressures occur in several dzs such as heart failure (decreased pumping), blood loss (decreased blood volume), aortic stenosis (reduced stroke volume), & cardiac tamponade (decreased filling time). In the majority of these cases, systolic pressures decrease while diastolic pressures remain near normal.
Source: https://www.ncbi.nlm.nih.gov/books/NBK482408/
TAKE-HOME MESSAGE
In this post hoc analysis of the DOREMI trial—a double-blind, randomized controlled trial comparing milrinone with dobutamine for the treatment of cardiogenic shock (CS)—57.7% of patients survived to hospital discharge. Complete lactate clearance (CLC), percentage lactate clearance (LC), and percentage LC per hour were independently associated with survival as early as 8 hours after trial enrollment. CLC was the most robust predictor of mortality at all time points, with total clearance at 24 hours being associated with 5.4-fold improved odds of in-hospital survival (P < .01).
These results underscore LC as a strong and independent predictor of in-hospital survival in patients with CS.
Source:
JA Marbach et al. Lactate Clearance as a Surrogate for Mortality in Cardiogenic Shock: Insights From the DOREMI Trial. J Am Heart Assoc 2022 Mar 15;11(6)e023322.
Dominance is defined by which coronary artery (RCA or LCA) gives rise to the posterior descending artery.
Source:
Coronary circulation of the heart - YouTube
The term "central venous pressure" (CVP) describes the pressure in the thoracic vena cava near the right atrium (therefore CVP and right atrial pressure are essentially the same). CVP is an important concept in clinical cardiology because it is a major determinant of the filling pressure and therefore the preload of the right ventricle, which regulates stroke volume through the Frank-Starling mechanism.
Source: CV Physiology | Central Venous Pressure
CPP of 15 to 20 mm Hg was predictive of successful resuscitation.
Animal models demonstrated that there is a minimum myocardial blood flow necessary for ROSC and that this is a function of the aortic-to-right atrial pressure gradient during the relaxation phase of cardiopulmonary resuscitation. This gradient has become accepted as the CPP during cardiopulmonary resuscitation.
CPP in the left ventricle is established by the pressure gradient between the aortic diastolic blood pressure and the left ventricular end-diastolic pressure (LVEDP) [3]:
Coronary Perfusion Pressure (CPP) = Aortic Diastolic Pressure – Left Ventricular end-diastolic Pressure (LVEDP)
CPP is based on diastolic pressures because the left ventricular myocardium gets perfused during diastole rather than systole. The right and left coronary arteries both originate from the AORTIC (mine) sinuses at the aortic root prior to division into the right coronary and left circumflex and anterior descending arteries; therefore, the pressure which drives coronary flow derives from the aortic root. These arteries extend along the epicardial surface before branching through the myocardium to form subendocardial plexuses to perfuse the myocardium. Because these vessels traverse the myocardium, myocardial contraction during systole compresses arterial branches and prevents perfusion. Therefore, coronary perfusion occurs during diastole rather than systole. LVEDP is subtracted from aortic diastolic pressure because coronary blood flow occurs from epicardial to endocardial regions.
While high left ventricular pressures are required to drive systemic circulation, the right ventricle generates lower pressures to perfuse the pulmonary circulation. Therefore, the right ventricular pressures are far lower than the pressures exerted by the left ventricle. Right ventricular perfusion occurs predominantly in systole because systolic aortic pressure exceeds systolic right ventricular pressure.[5] The right ventricle is also perfused to a lesser degree in diastole when aortic diastolic pressure exceeds right ventricular end-diastolic pressure by a smaller differential.
Source: Coronary Perfusion Pressure - StatPearls - NCBI Bookshelf (nih.gov)
The aortic root bulges outwards to form the three sinuses. Two of the aortic sinuses give rise to the main coronary arteries and the sinuses are termed right and left coronary sinuses. The third sinus is conveniently termed the non-coronary aortic sinus.