Oxygenation page Pulmonary Exam page Pulmonary physiology page Pulm HTN page
Asthma vs COPD page Pneumonia page Fishman Pulmonary page
Flow-Volume loops page Crashing asthmatic page PFT cases page
West Lung Zones page PFT WebApp page Pulmonary Embolism page

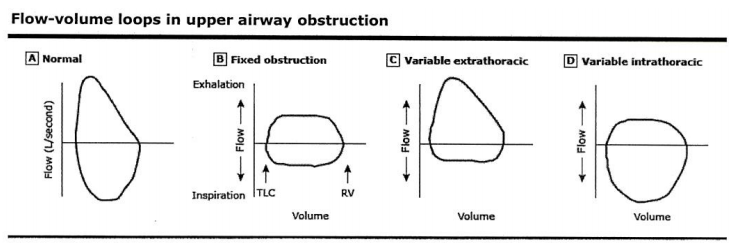
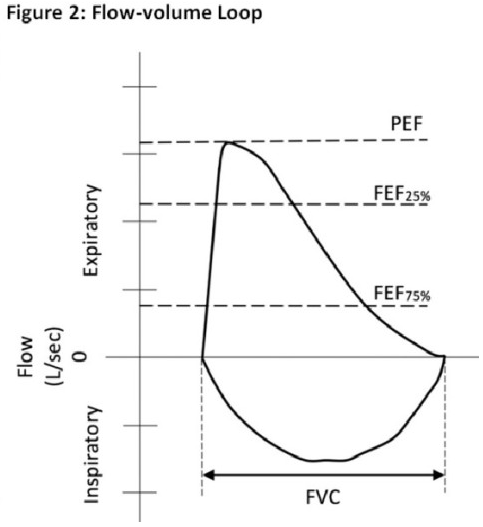
Variable intrathoracic obstruction may be caused by tracheomalacia, polychondritis, & tumors of the lower trachea or main bronchus.
Variable extrathoracic obstruction may be caused by bilateral and unilateral vocal cord paralysis, vocal cord constriction, reduced pharyngeal cross-sectional area, and airway burns.
Source: Inspiratory Flow Curve article
---
Spirometry
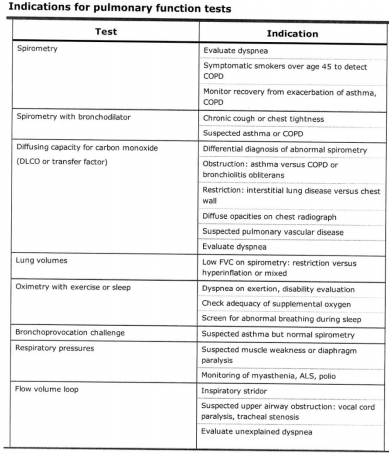
Primarily focuses on airflow during both inhalation and exhalation. Results can be broken down into a plethora of measured values, only a few of which are of key importance for “routine” interpretation:
Forced expiratory volume in 1 second (FEV1): Measurement of the total volume exhaled in the first 1 second.
Forced vital capacity (FVC): Total amount of volume exhaled, and exhalation must last over a period of at least of 6 seconds. In patients with severe obstructive lung disease, this may underestimate the total amount of volume that can be expired (i.e., the true vital capacity).
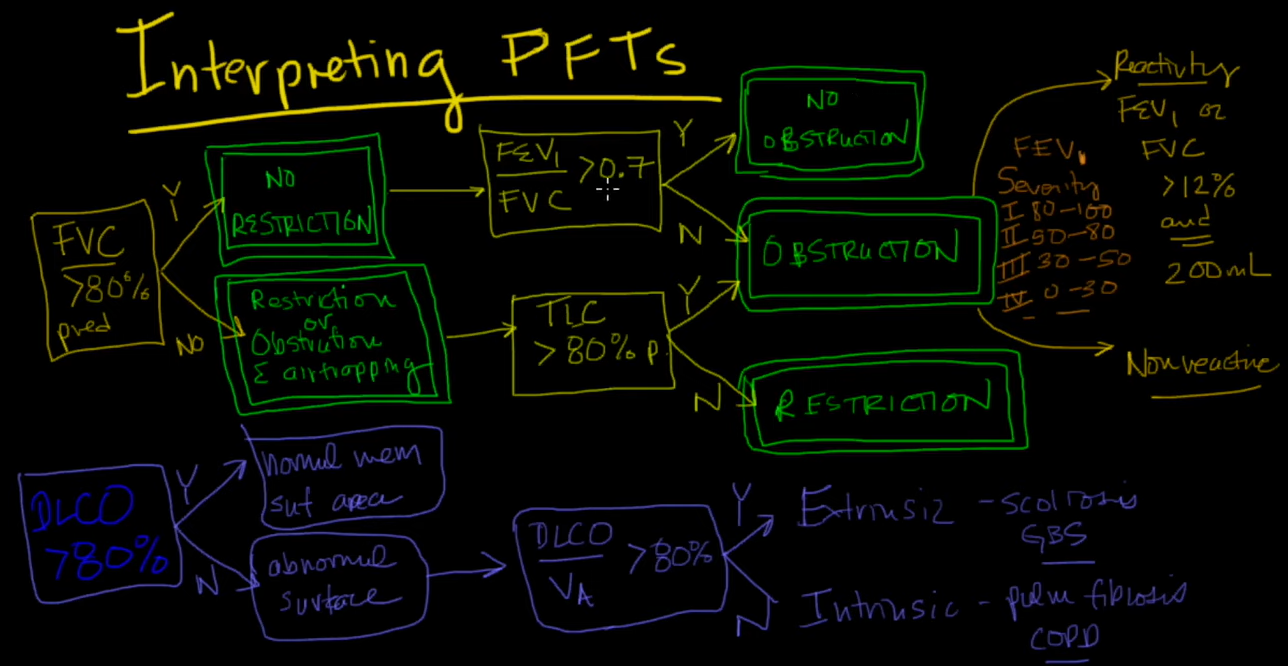
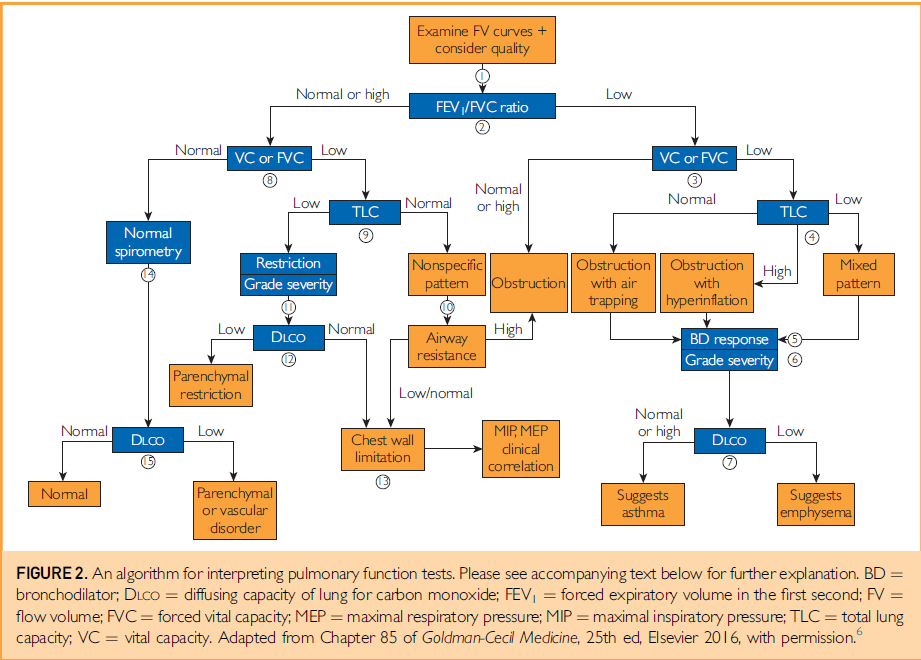
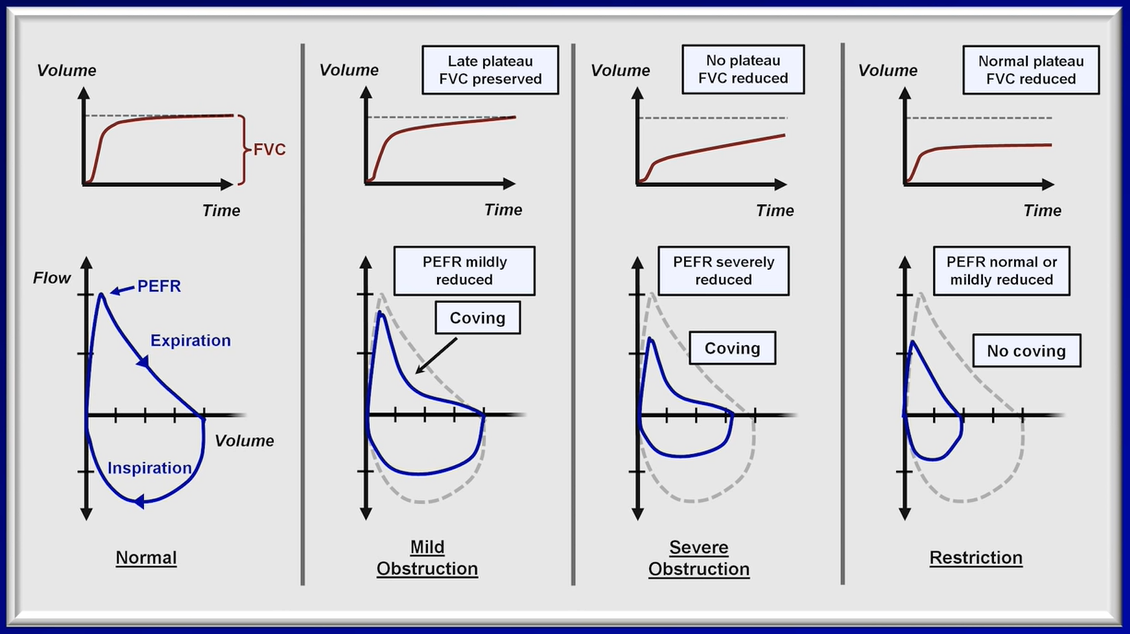
FEV1/FVC ratio: This ratio is key to determining whether obstruction is present, defined as a reduction in this ratio. An elevated ratio may only suggest restriction, but not establish it.
Forced expiratory flow 25-75% (FEF25-75): Mean flow between 25-75% points of FVC. Can be considered a “tie-breaker” in the setting of borderline obstruction. Reflects the concavity of a flow-volume loop in numerical form.
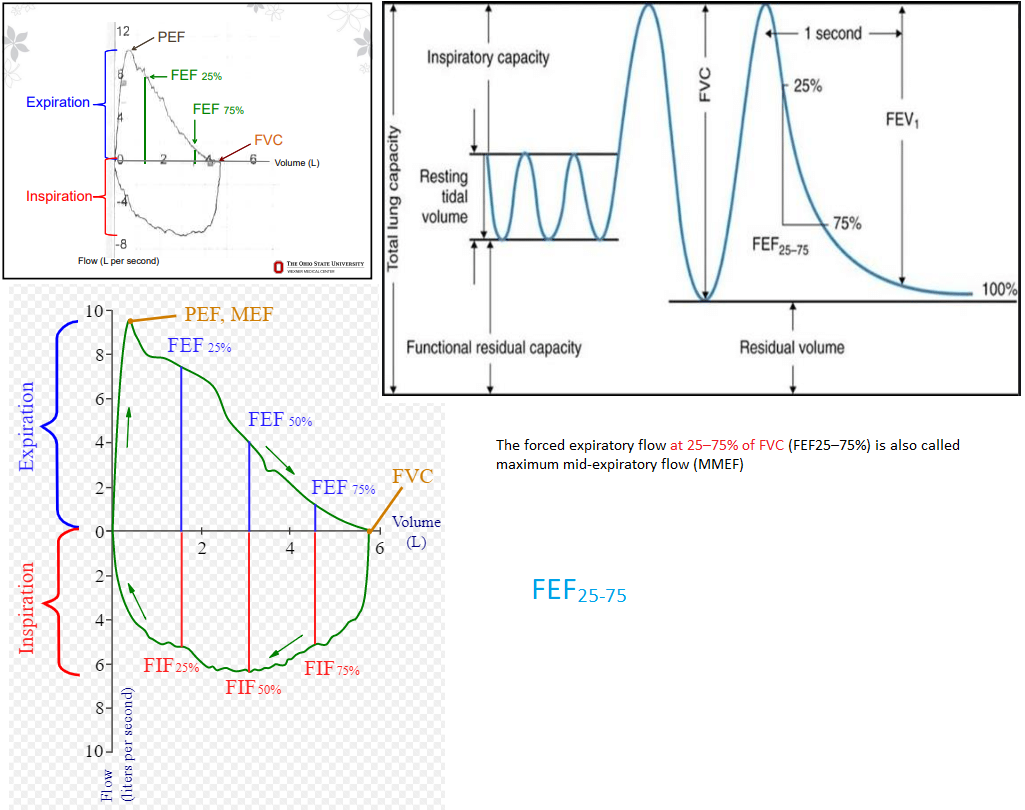
The test is performed with the patient sitting upright in a chair. A nose clip is used to block the nares, and a mouthpiece is inserted. After a few tidal breaths, the patient takes a full breath in, then immediately exhales are rapidly as able, for a minimum of 6 seconds, followed again by a full, rapid inhalation. Multiple attempts can be made, and the “best” values (rather than the average values) are chosen from the set.
Although technical aspects of test administration are not within the scope of this text, a few key points are relevant. Proper spirometry requires acceptability within each maneuver and reproducibility between maneuvers.
Acceptability refers to adequacy of patient effort on each individual attempt. This requires maximal effort with adherence to the duration requirements for inhalation and exhalation, because anything short of this can profoundly limit reliable interpretation of results. Care should be taken that language barriers do not impact the results. For this reason, the physician is encouraged to review comments from the technician, which may indicate certain difficulties. In addition, acceptability implies an attempt that is without artifacts, such as coughing, as these may also hinder the reliable interpretation of results.
Reproducibility implies that after at least three acceptable attempts are completed, the two largest values for FEV1 and FVC are within 0.15 L of each other.
Plethysmography
Also referred to as the “body box,” this is the most common process by which lung volumes are determined. This can be a time-consuming procedure, and requires significant patient understanding and cooperation to ensure accuracy. It is often not routinely ordered by inexperienced practitioners. Plethysmography may not be required for serial PFTs in patients with a known obstructive pulmonary process, but can be key to determining an underlying disorder in a symptomatic patient. Because this maneuver takes place in a sealed box, it can be difficult in patients with decreased hearing. It cannot be reliably performed in the patients with requisite tubing attachments such as supplemental oxygen, chest tubes, or continuous intravenous infusions.
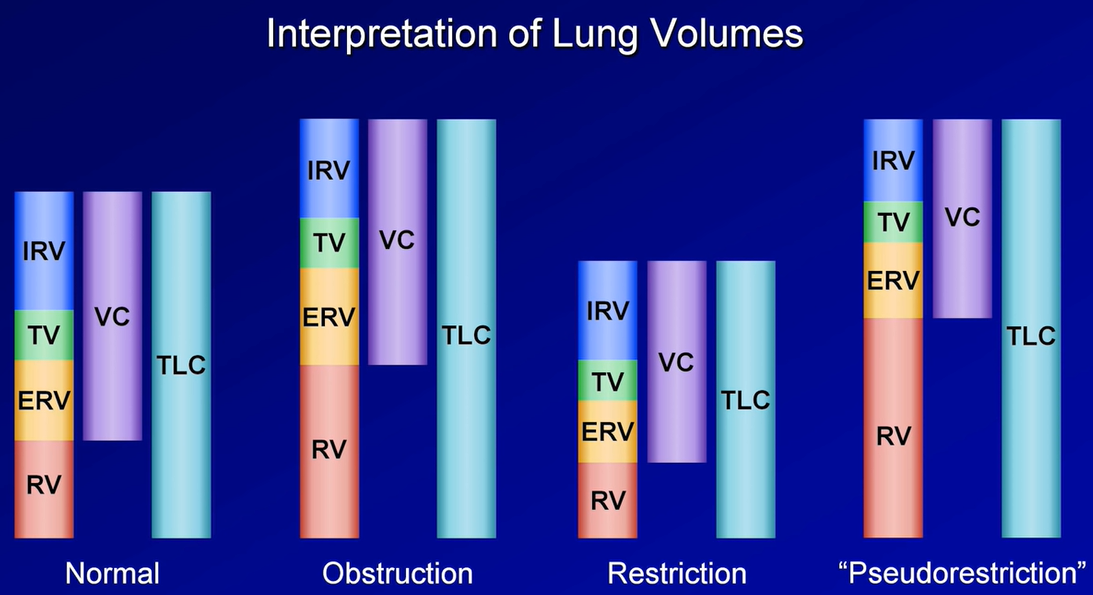
Total lung capacity (TLC): This refers to the total amount of air in the chest, and is key to diagnosing hyperinflation or restriction.
Vital capacity (VC): Similar to the FVC as described above, but is measured in the absence of forced exhalation.
Residual volume (RV): Volume of gas that remains in the chest after full exhalation. Can be elevated in obstructive lung processes with air trapping. Key to differentiating a restrictive lung process secondary to extrapulmonary processes such as obesity, chest wall stiffness, or muscle weakness (normal RV), from those related to intrinsic parenchymal disease such as pulmonary fibrosis (reduced RV).
RV/TLC ratio: Specifically refers to the proportion of residual gas as a part of total gas in the chest. May provide more information about whether air trapping is present in patients with an abnormal TLC.
Expiratory reserve volume (ERV): The maximum amount of air that can be exhaled after normal exhalation at tidal volume, leaving only the RV in the chest.
Functional reserve capacity (FRC): The total amount of air remaining in the chest after normal exhalation at tidal volume. FRC = RV + ERV.
Other techniques less commonly employed to measure lung volumes include nitrogen washout and gas dilution methods. Differences between these techniques and plethysmography may affect the accuracy of lung volume measurements in certain situations such as with COPD (see “Interpretation of Results” below).
Diffusing Capacity
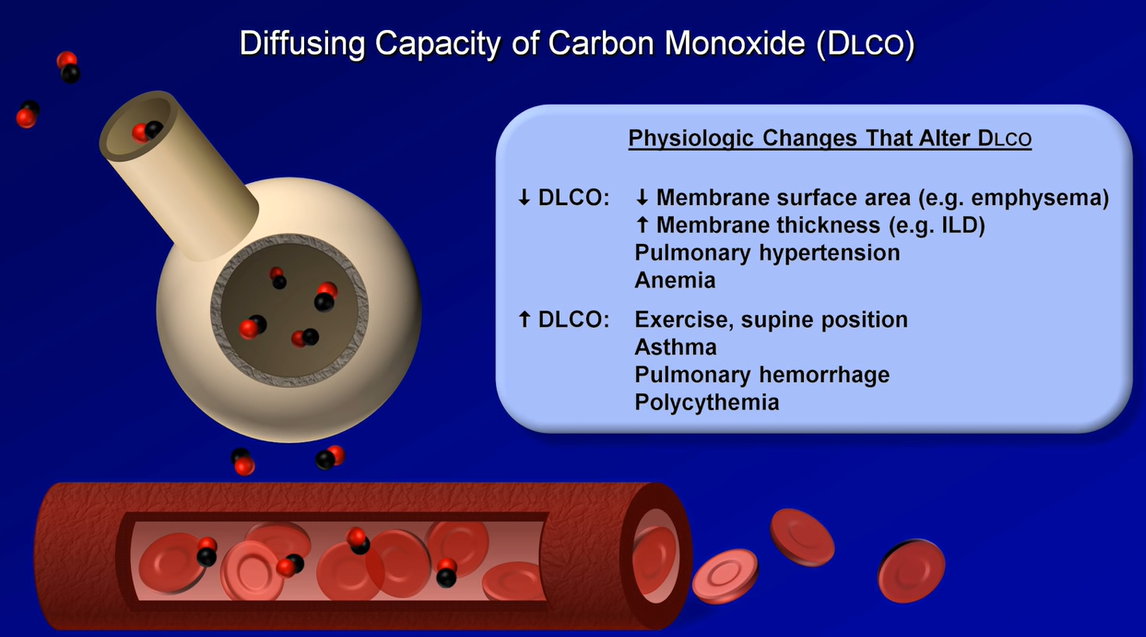
Diffusing capacity, also referred to as ‘diffusing capacity of the lung for carbon monoxide’ (DLCO), is a surrogate for the lung’s ability to perform oxygen uptake. Carbon monoxide and oxygen have similar diffusion properties across the alveolar-capillary interface. This value is affected by thickening of this interface, ventilation/perfusion mismatching, total hemoglobin concentration, altitude, pO2, and carboxyhemoglobin levels. DLCO can be a useful early marker for pulmonary fibrosis, chronic pulmonary vascular disease, and toxicity from drugs such as amiodarone or bleomycin.
Patients performing this maneuver via the single breath method inhale a very low concentration of carbon monoxide (usually about 0.3%). Breath is held for 10 seconds, then exhaled completely. The DLCO maneuver is determined by measuring the concentration of carbon monoxide exhaled in a post-dead space sample of alveolar gas.
Results may be erroneously elevated in patients who hold their breath longer than instructed.
DLCO may be underestimated in heavy smokers with an elevated baseline carboxyhemoglobin value.
All results should be corrected for current hemoglobin concentration, as anemia or polycythemia will underestimate or overestimate DLCO, respectively.
Other testing
For specific scenarios or clinical questions, practitioners may request additional testing.
1. Respiratory muscle strength assessment
Maximal inspiratory pressure (MIP) and maximal expiratory pressure (MEP) may be measured. The patient is instructed to maximally inhale or exhale against a gated chamber, and pressures in the chamber are measured. Useful in determining the presence or progress of neuromuscular disease, this is routinely ordered in myasthenia gravis crises or amyotrophic lateral sclerosis patients, for example. Clinically significant weakness is not typically seen until measured MIP and MEP values are extremely abnormal. Has a high negative predictive value for ruling out significant respiratory muscle disease.
2. High altitude simulation testing
Oxygen saturation is measured while patients inhale lower-than-normal atmospheric oxygen concentrations. Fifteen percent inhaled oxygen is typically used, equivalent to oxygen concentration at 8,000 ft of elevation. Often used to simulate airplane travel to determine whether a patient might need supplemental oxygen.
3. Cardiopulmonary exercise testing
Cardiopulmonary exercise testing is known as CPET and is also referred to as maximum exercise cardiopulmonary testing. A useful test to determine the etiology of exercise limitation in patients in whom the cause is unclear after routine testing. Patients must demonstrate maximal exertion, often on a stationary bicycle, treadmill, or hand-pedaled ergometer. Expired gases are measured, with frequent determinations of CO2 (carbon dioxide) and O2 (oxygen) concentrations, and continuous electrocardiogram (ECG) monitoring. When properly performed and interpreted, this can determine inadequate cardiac response, ventilation limitation, simple deconditioning, or neither as the cause of a patient’s symptoms. This test should only be performed in a specialized exercise laboratory with experienced clinicians, as it is prone to misinterpretation.
4. Bronchodilator testing
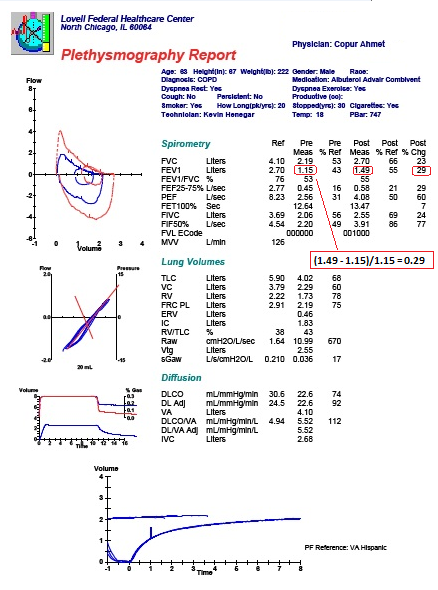
Spirometry is performed before and after administration of bronchodilators to determine physiologic responsiveness, often when asthma is suspected. Inhaled beta agonists or anticholinergic agents can be used, and an appropriate time delay before repeat testing must be observed. An increase in FEV1 by 12% and 200 milliliters is considered “positive.” False negatives may occur if the patient recently used other bronchodilators prior to testing. It is important to point out that a lack of demonstrable improvement does not necessarily predict a lack of clinical benefit.
5. Airway challenge
Most often performed with inhaled methacholine, the airway challenge tests for airway hyperresponsiveness to inhaled irritants and is often ordered to diagnose or rule out asthma in patients with atypical symptoms (e.g., chronic cough). Increasing concentrations of methacholine are used, with FEV1 measured repeatedly. A reduction in FEV1 of 20% from the pre-challenge value is considered positive at methacholine concentrations of 16 milligrams/milliliters or less. Results must be interpreted in light of the clinical scenario. Testing may be negative in an asthma patient without current symptoms, or in patients with exercise-induced asthma who may respond robustly to cool air. It may be positive in 5-15% of otherwise normal individuals. Of note, all inhaled and oral bronchodilator therapies must be held for a pre-specified period of time prior to testing in order for the results to be accurate.
Interpretation of results
Spirometry
1. Review technician comments, including statements pertaining to acceptability and reproducibility of attempts, such as inability to perform the test properly, inability to understand instructions, or submaximal effort. Interpretation of suboptimal testing should be done with great caution.
2. Review flow-volume loops, if available. A concave expiratory limb suggests obstruction. Smaller loops with flat expiratory limbs suggest restriction. Jagged or abrupt changes in flow may represent cough or glottic closure. Familiarize yourself with normal flow-volume loops in order to better recognize those which are abnormal. Some pathologies, such as fixed airway obstructions (e.g., tracheal tumor) may only be appreciated by reviewing the flow-volume loop.
3. Review FEV1/FVC ratio. If <5th percentile, obstruction is present. If elevated to >95th percentile, restriction is suggested, but cannot be diagnosed unless lung volumes are available for confirmation.
If obstruction is present, a number of criteria (Global Initiative for Chronic Obstructive Lung Disease or American Thoracic Society/European Respiratory Society [ATS/ERS]) can be used to categorize its severity. Most commonly used by pulmonologists are the ATS/ERS guidelines on interpretation of PFTs from 2005:
If FEV1/FVC ratio is <5th percentile and FEV1:
>70% predicted is defined as mild obstruction.
60-69% predicted is defined as moderate obstruction.
50-59% predicted is defined as moderately severe obstruction.
35-49% predicted is defined as severe obstruction.
<35% predicted is defined as very severe obstruction.
4. If FEV1/FVC ratio is borderline low, a decreased FEF25-75 may suggest early obstructive disease.
Plethysmography
1. Review technician comments, including statements such as inability to perform the test properly, inability to understand instructions, or submaximal effort. Any attempt to interpret suboptimal testing should be done with great caution.
2. Review TLC. If elevated >95th percentile, hyperinflation may be present. If reduced <5th percentile, restriction is present.
If restriction is present:
Reduced VC confirms restrictive lung process.
Check RV. A reduced residual volume suggests intrinsic lung disease such as pulmonary fibrosis. If normal, an extra-pulmonary pathology such as obesity, chest wall deformity, or neuromuscular weakness may be present.
3. Review RV and RV/TLC ratio. Elevated RV and RV/TLC ratio suggest air trapping with obstructive lung disease.
4. If available, compare TLC as measured by plethysmography with that measured by gas dilution techniques (such as helium dilution or nitrogen washout). Plethysmography measures total compressible gas in the chest, whereas dilution techniques measure communicating (participating in gas-exchange) airspaces only. Thus, larger volumes measured by plethysmography then by dilution suggest the presence of non-communicating (or non-functional) airspace, such as with severe emphysema, pneumothorax, or bullous disease.
Diffusing Capacity
1. Review technician comments, including statements such as inability to perform the test properly, inability to understand instructions, or submaximal effort. Any attempt to interpret suboptimal testing should be done with great caution.
2. Check for recent hemoglobin and carboxyhemoglobin levels. If values are available, be sure to review raw data as well as corrected value.
3. DLCO is normal between 5th and 95th percentiles.
4. DLCO >95th percentile may be seen in polycythemia, alveolar hemorrhage, or severely depressed cardiac output, among other causes.
5. DLCO <5th percentile suggests pulmonary vascular disease, interstitial lung disease, emphysema, or lung resection, among other causes.
If DLCO is reduced:
DLCO >60% predicted is defined as a mild reduction.
DLCO 40 – 60% predicted is defined as a moderate reduction.
DLCO <40% predicted is defined as a severe reduction.
Special Considerations
GOLD vs. ATS/ERS Guidelines: GOLD guidelines for the interpretation of spirometry values differ considerably from the ATS/ERS guidelines. Therefore, it is important to note which guidelines are used routinely at your institution in order to avoid confusion.
Air trapping vs. hyperinflation: Air trapping and hyperinflation are not synonymous. Air trapping tends to precede hyperinflation & refers to an elevated RV in the setting of a normal TLC. When TLC is also elevated above the upper limit of normal, then hyperinflation is present.
--air-trapping if RV/TLC% is higher than 126% of predicted by the plethysmographic method or 128% of predicted by the helium dilution method, and no air-trapping if RV/TLC% is equal to or under those values;
Source: Herranz A. RV/TLC% ratio: alternative criteria of normality. Eur Respir J, 1995, 8, 1812–1813.
Bronchial spasm, airway inflammation, excessive secretions in the airway, & loss of lung elastic recoil increase airways resistance & result in an insidious progressive increase in the end-expiratory lung volume that results in chronic hyperinflation (elevated RV, TLC, & RV-to-TLC ratio).
Obesity: There is some speculation and discrepant opinion regarding how obesity affects pulmonary function tests, but there is general consensus on the following:
Spirometry – Data suggest that increasing BMI does increase airway resistance which may lead to increased dyspnea among overweight and obese patients. However, FEV1 and FVC are minimally diminished, if at all, and the FEV1/FVC ratio is preserved. Flow rates may appear reduced (owing to diminished lung volumes, see below) but are within normal range when adjusted for actual and not predicted lung volumes.
Lung volumes – Recent data show that, though FRC and ERV can be significantly decreased in overweight (BMI 25-29.9 kilograms/meters2 [kg/m2]) and obese (BMI ≥30 kg/m2) patients, TLC may only decrease slightly, even in morbidly obese (BMI ≥ 35-40 kg/m2) patients. RV is also well-maintained in severe obesity. *Keep this in mind before attributing unexpected restrictive lung physiology to obesity. Also keep in mind that the distribution of fat in an obese patient matters – abdominal and thoracic fat contribute more to changes in lung volumes than lower body fat which should not affect lung volumes at all.
DLCO – Increases slightly with increasing BMI but remains within normal range. Therefore, DLCO is not significantly affected by obesity.
Overall, obesity may exaggerate symptoms and PFT abnormalities in a patient with pre-existing lung disease.
Pregnancy: The diaphragm may rise approximately 4 centimeters above normal at full-term, but the lower rib cage and supporting muscles will also undergo compensatory changes in order to maintain diaphragmatic excursion. Airway resistance is also maintained.
Spirometry – NOT significantly affected during pregnancy.
Lung volumes – Expect a progressive decline in ERV, RV, and FRC throughout pregnancy (partly due to diaphragmatic elevation). TLC, however, may only decrease slightly at full-term.
DLCO – May increase in the first trimester but will likely decrease toward baseline values thereafter, owing to changes in pulmonary blood flow and other mechanisms that are not well-understood.
Other:
FEV1 % predicted (contrary to intuition) does not invariably correlate with patient symptoms and may not be a good predictor of clinical severity or prognosis in individual patients. In other words, a patient with a higher FEV1 may present with worse symptoms and more frequent exacerbations than a patient with a lower FEV1.
All measurements are compared with predicted or “reference” values that are obtained based on age, height, race, and sex. Therefore, an error or variation in any one of these data can affect the accuracy of the % predicted (and thus, the interpretation of the results). Furthermore, as flows and volumes are based on height – a patient who has a relatively short or long torso for his/her height may show values that are falsely low or falsely high, respectively.
Summary
Pulmonary function testing encompasses a broad range of maneuvers, measuring airflow, lung volumes, gas diffusion, responses to inhaled bronchodilators or irritants, respiratory muscle strength, and maximal cardiopulmonary ability. Choosing the correct tests for the questions to be answered is key. PFT’s can be reliably interpreted in most cases, assuming appropriate patient cooperation, understanding, and effort. While a “by the numbers” approach to interpreting results is often employed to enhance consistency across tests, knowledge of the clinical scenario and pretest probability ensures optimal and accurate interpretation for the individual patient.
PFT Videos
Spirometry, Lung Volumes, Capacities--Ninja Nerd
Forced Spirometry & PFTs -- ninja nerd
Mechanical Ventilation
Dynamic Hyperinflation: Adding Extrinsic PEEP
Transpulmonary Pressure/Distending Pressure
Positive pressure effects on LV afterload
AbdominoThoracic Pump animated gif
---
Increase in the FEV1 of more than 12% or greater than 0.2 L (or 200 mL) suggests acute bronchodilator responsiveness.
Air trapping: FRC or RV is increased (>120% of predicted)
Hyperinflation: TLC is increased (>120% of predicted)
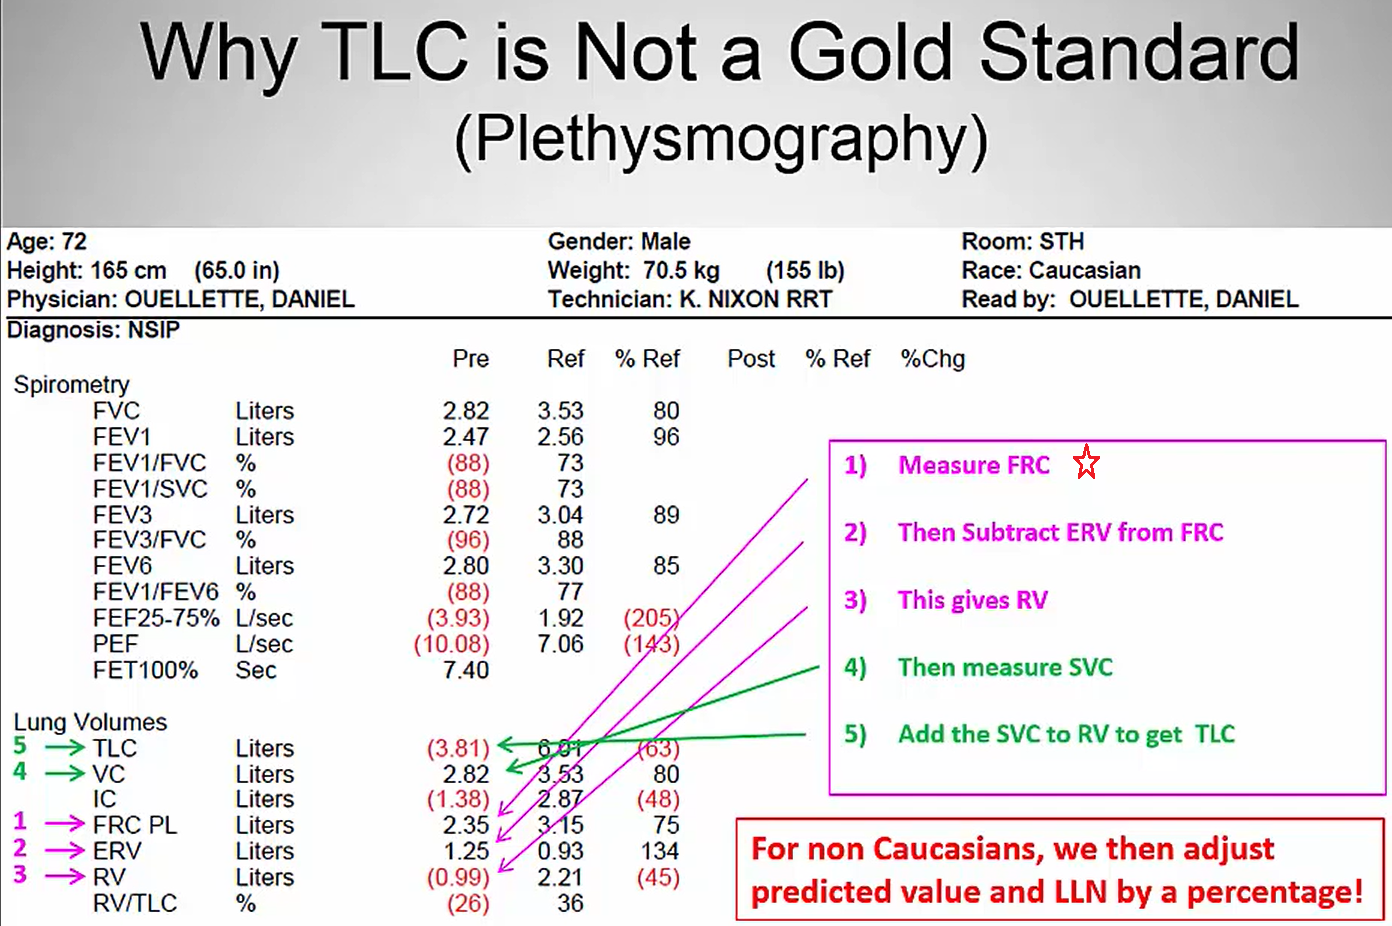
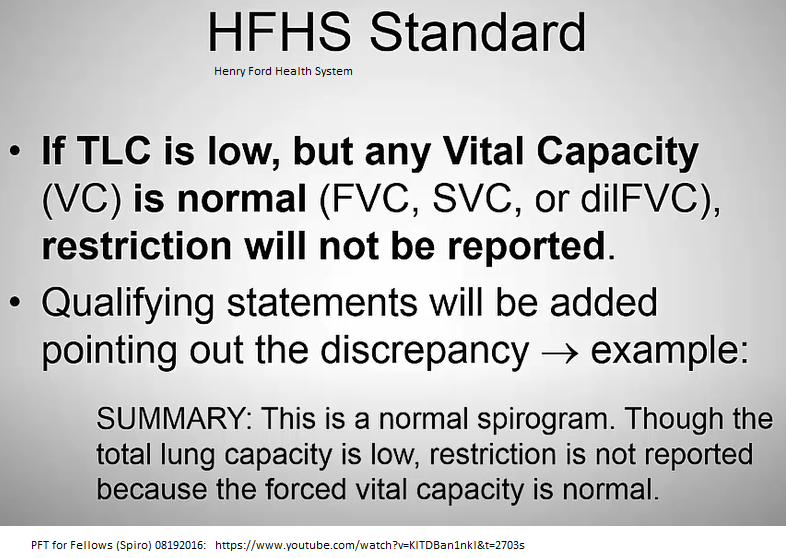
Capacities are the sum of 2 or more volumes. TLC is the gold standard for diagnosis of restrictive lung disease. TLC < 5 percentile of predicted or < 80% predicted are diagnostic of a restrictive ventilatory defect.
Source: https://www.ncbi.nlm.nih.gov/books/NBK541029/
How TLC is measured (see image below)
Air trapping in chest imaging refers to retention of excess gas (“air”) in all or part of the lung, especially during expiration, either as a result of complete or partial airway obstruction or as a result of local abnormalities in pulmonary compliance.
Elevated RV and RV/TLC ratio suggest air trapping with obstructive lung disease.
Air trapping vs. hyperinflation: Air trapping & hyperinflation are not synonymous. Air trapping tends to precede hyperinflation & refers to an elevated RV in the setting of a normal TLC. When TLC is also elevated above the upper limit of normal, then hyperinflation is present.
Source: https://www.cancertherapyadvisor.com/home/decision-support-in-medicine/hospital-medicine/pulmonary-function-tests/#:~:text=Air%20trapping%20vs.,normal%2C%Hyperinflation TLC is increased (>120% of predicted)%20hyperinflation%20is%20present.
Air trapping: FRC or RV is increased (>120% of predicted).
Hyperinflation: TLC is increased (>120% of predicted).
The normal range for DLCO is as follows: 80–120% of its predicted value for men. 76–120% of its predicted value for women.
If pt has DLCO that is < 50% predicted, they will experience O2 desaturation when they exercise.
Maximal inspiratory pressure (MIP) Maximal expiratory pressure (MEP)
The average MIP & MEP for adult men are -100 & + 170
For adult women are about -70 & +110
RV/TLC is ~ 20% in younger pts; up to 35% in older pts.
Elevated RV & RV/TLC ratio suggest air trapping with obstructive lung disease.
Obstructive lung diseases, particularly emphysema, result in an increase in the RV and RV-to-TLC ratio. In severe emphysema, particularly bullous emphysema, the TLC can show a marked increase. Bronchial spasm, airway inflammation, excessive secretions in the airway, and loss of lung elastic recoil increase airways resistance and result in an insidious progressive increase in the end-expiratory lung volume that results in chronic hyperinflation (elevated RV, TLC, and RV-to-TLC ratio). Other pulmonary causes of increased RV include pulmonary vascular congestion and mitral stenosis. Extrapulmonic causes of increased RV include expiratory muscle weakness as observed in spinal cord injuries and myopathies.
Increased body weight due to increased fat causes an increase in chest wall elastic recoil, which favors a lower end-expiratory lung volume, resulting in less hyperinflation for any degree of airflow obstruction.
Lung volumes can confirm the presence of restriction when a reduced vital capacity is seen on spirometry. A reduced TLC is the hallmark of restrictive lung disease. An isolated reduction of the residual volume may be an early sign of restrictive lung disease. Pulmonary processes that can reduce the TLC include interstitial lung disease, atelectasis, pneumothorax, pneumonectomy, consolidation, edema, & fibrosis. Extrapulmonary causes of restriction include obesity, respiratory muscle weakness, thoracic deformities, & disease of the pleura.
Diagnosis
Diagnosing VCD can be challenging. The history of breathing difficulties when taking in a breath, having a hoarse voice or experiencing voice changes may be very helpful to discuss with your allergist / immunologist. This may lead to further tests such as spirometry or laryngoscopy.
Spirometry is a breathing test that measures airflow. A laryngoscopy involves looking at the vocal cords through a camera attached to a flexible tube. Vocal cords should be open when taking in a breath. In some people with VCD, the vocal cords actually close instead of opening.
Visit the Asthma vs COPD page here
Sources:
https://www.ncbi.nlm.nih.gov/books/NBK482339/ Pulmonary Function Tests
Asthma: FEV1, FVC & FEV1/FVC are all >= 80% predicted before bronchodilators
PFT is not required if the only treatment is PRN use on one or two days a week of a short-acting beta agonist (e.g. albuterol).
Source: https://www.faa.gov/about/office_org/headquarters_offices/avs/offices/aam/ame/guide/media/guide.pdf
Alveolar dead space (ADS)
ADS => V/Q = infinite bec Q is ~0. Alveolar dead space is the volume of gas within unperfused alveoli (and thus not participating in gas exchange either); it is usually negligible in the healthy, awake pt. Q is blood flow. Mine: think apex areas of lung.
Anatomic dead space
Anatomic dead space is the volume of gas within the conducting zone (as opposed to the transitional & respiratory zones) & includes the trachea, bronchus, bronchioles, & terminal bronchioles; it is approximately 2 mL/kg in the upright position.
https://www.openanesthesia.org/aba_respiratory_function_-_dead_space/
Physiological (total) dead space = (alveolar dead space + anatomic dead space) = alveolar shunt = V/Q = 0
PDS = Physiologic or total dead space is the sum of anatomic dead space & alveolar dead space.
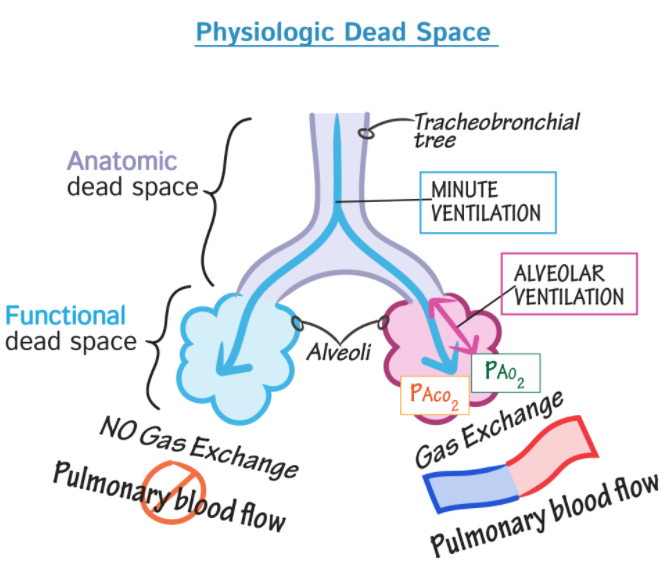
Dead space is the volume of a breath that does not participate in gas exchange. It is ventilation without perfusion. Physiologic or total dead space is the sum of anatomic dead space & alveolar dead space.
The ratio of physiologic dead space to tidal volume is usually about 1/3. Example: if it's 0.45, then there's more physiologic dead space . . . which is bad.
According to the European Respiratory Society (ERS) and the American Thoracic Society (ATS) task force for standardization of lung function testing, the FEF25-75 is defined as the mean forced expiratory flow between the 25% & 75% of the FVC, which some have interpreted as a quantitative measure of small airways (<2 mm) obstruction. Indeed, since the 1970s FEF25-75% rates were proposed to be a marker of small airway obstruction & a more sensitive way to detect early stages of obstructive airway disease. However, others have argued that FEF25-75% is highly variable and neither sufficiently sensitive nor specific to diagnose obstructive lung disease. Moreover, FEF25-75% has not been shown to correlate with other physiologic or histologic measures of distal lung inflammation. Using computed tomography airway morphometric analysis, FEF25-75% has been shown to be moderately & inversely correlated with the bronchial wall area (WA) and WA corrected for body surface area, though not exclusively in the small airways. Although it is possible that FEF25-75% predominantly reflects flows derived from more distal airways, there is insufficient data to support the concept that variability in this measure is specific to small airway changes. Despite these limitations, FEF25-75% continues to be part of the standard spirometry report. More importantly, there are no recommendations as to how reductions in this measure should be taken into consideration for asthma treatment or for risk stratification.
Articles:
pulm/FEF25_75_asthma_Riley_2015.pdf
https://www.youtube.com/watch?v=LD56nfl3zSE -- RT Clinic : NIPPV Bipap settings and management
https://www.youtube.com/watch?v=G5ddRZ52aSs --Respiratory Therapy - Plateau Pressure and Static Compliance in Pressure Control
https://www.youtube.com/watch?v=-ZHVHVHklVo -- APRV Workshop by Dr. Nader M. Habashi, MD, FACP, FCCP
Alveolar shunt: => V/Q = 0; no ventilation, yes perfusion. AKA physiological dead space.
Shunt occurs when venous blood mixes with arterial blood either by bypassing the lungs completely (extra-pulmonary shunt) or by passing through the lungs without adequate oxygenation (intra-pulmonary shunt).
Intrapulmonary shunt is defined as that portion of the cardiac output entering the left side of the heart without undergoing perfect gas exchange with completely functional alveoli.
Causes of shunt include pneumonia, pulmonary edema, ARDS, alveolar collapse, & pulmonary arteriovenous communication.
Source:
https://acutecaretesting.org/en/articles/setting-the-record-straight-on-shunt
What is the difference between an anatomic shunt & a physiologic shunt?
Extra-pulmonary shunt: does this include examples such as: atrial septal defect?
Usually, atrial septal defects result in a left-to-right shunt.
A right-to-left shunt is a cardiac shunt which allows blood to flow from the right heart to the left heart--eg, VSD
The most common cause of right-to-left shunt is the Tetralogy of Fallot, a congenital cardiac anomaly characterized by four co-existing heart defects.
Pulmonary stenosis (narrowing of the pulmonary valve and outflow tract, obstructing blood flow from the right ventricle to the pulmonary artery)
Overriding aorta (aortic valve is enlarged and appears to arise from both the left and right ventricles instead of the left ventricle, as occurs in normal hearts)
Right ventricular hypertrophy (thickening of the muscular walls of the right ventricle, this is a result of the increased amount of work the heart has to do)
Ventricular septal defect (a hole exists in the septum that divides the left & right ventricles)
Qs/Qt = (CcO2 - CaO2)/(CcO2 - CvO2)
If a diagnosis of NSCLC is made on pleural-fluid cytology, this automatically upstages the malignancy to stage IV and indicates non-curable disease.
Go to page here
P/F ratio equals the arterial pO2 (“P”) from the ABG divided by the FIO2 (“F”) – the fraction (%) of inspired oxygen that patient is receiving expressed as a decimal (40% oxygen = FIO2 of 0.40).
P/F Ratio < 300 = acute respiratory failure.
The P/F ratio is a powerful objective tool to identify acute hypoxemic respiratory failure when supplemental O2 has already been administered & no room air ABG is available, or pulse oximetry readings are unreliable.
The reporting of PaO2 /FIO2 values should come with a health warning. See article.
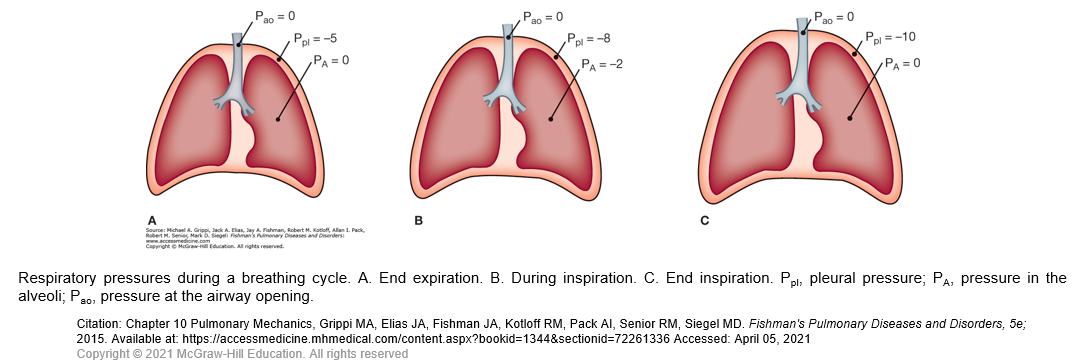
During spontaneous breathing, the action of the inspiratory muscles causes an increased outward pull on the chest wall. As a result, the pleural pressure becomes more subatmospheric. This pressure change is transmitted to the interior of the lungs, so alveolar pressure also becomes subatmospheric. In contrast, during artificial ventilation with a positive-pressure ventilator, a supra-atmospheric pressure applied at the inlet to the airways creates the proper pressure gradient between the airway opening and alveoli for airflow.
Expansion of alveoli depends on the achievement of an appropriate distending pressure across alveolar walls. This distending pressure or transpulmonary pressure is the difference between alveolar (PA) and pleural (Ppl) pressures. As shown in Figure A, the transpulmonary pressure at end expiration (PA − Ppl) is 5 cmH2O. At the end of inspiration, the lungs contain more air and the distending pressure which also represents the recoil pressure is greater.
The energy used during inspiration to overcome the elastic resistance of the lungs is stored. Expiration occurs when these forces are released. When the inspiratory muscles relax, the recoil of the lungs causes the alveolar pressure to exceed the pressure at the mouth, and air flows out of the lungs. Although expiration during quiet breathing is passive, the expiratory muscles are engaged at high levels of ventilation to assist the movement of air out of the lungs.
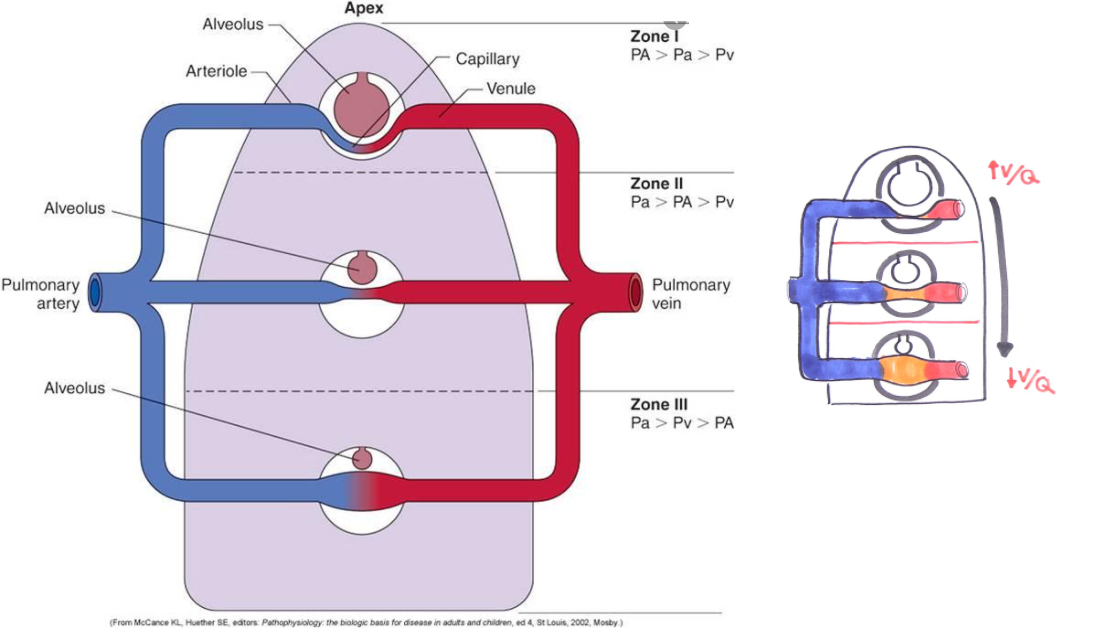
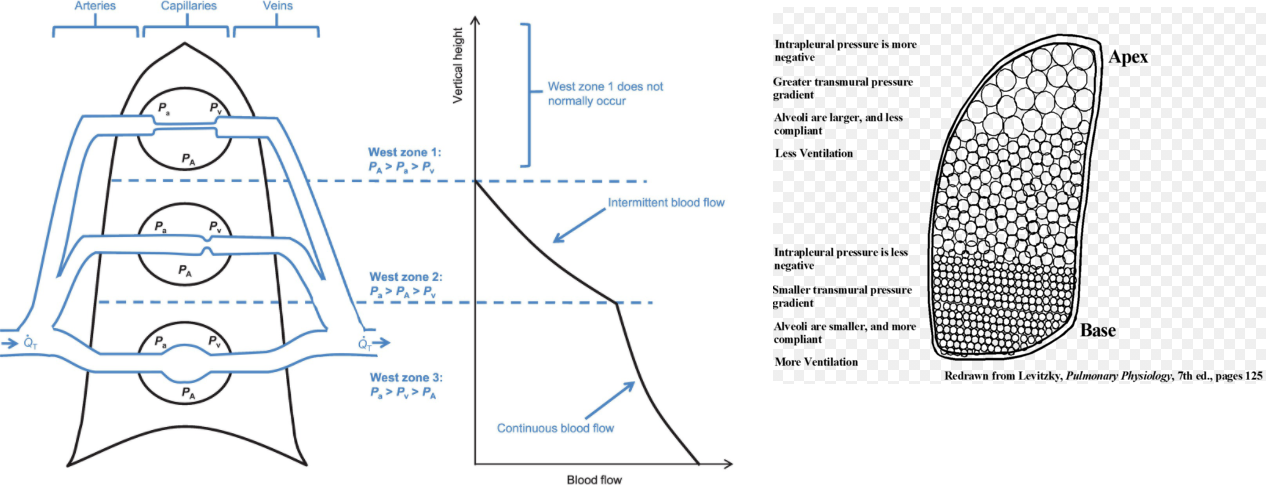
V/Q ratio evaluates the matching of ventilation (V) to perfusion (Q). There is regional variation in the V/Q ratio within the lung.
Ventilation is 50% greater at the base of the lung than at the apex. The weight of fluid in the pleural cavity increases the intrapleural pressure at the base to a less negative value. As a result, alveoli are less expanded & have higher compliance at the base, resulting in a more substantial increase in volume on inspiration for increased ventilation.
Perfusion is also greater at the base of the lung due to gravity pulling blood down towards the base. Overall, perfusion increases more than ventilation at the base of the lung, resulting in lower V/Q ratios in the base of the lung compared to the apex.
In a healthy individual, the V/Q ratio is 1 at the middle of the lung, with a minimal spread of V/Q ratios from 0.3 to 2.1 from base to apex. In cases of high V/Q ratios, PO2 increases and PCO2 decreases as alveolar air more closely matches the larger volume of inspired air than perfused blood. On the other hand, low V/Q ratios result in a decreased PO2 and an increased PCO2.
Source:
Powers K, et al. Physiology, Pulmonary Ventilation and Perfusion
Videos:
Boards & Beyond Step 1: Ventilation and Perfusion
The patient’s oxygen saturation rose from 88% to 95% after the administration of 5 L of supplemental oxygen through a nasal cannula. Chest radiographs were obtained and revealed several central opacities in the alveolar tissue (Panel A, arrows) and the interstitial tissue (Panels A and B, arrowheads), with sparing of the lung periphery. The heart was normal in size, and no pleural effusions were seen.
In elucidating the cause of hypoxemia, it is useful to measure the alveolar-to-arterial oxygen gradient, which is calculated as the difference between the oxygen tension in the alveoli (PAO2) and in the arterial blood (PaO2). This patient’s PaO2 is 52 mm Hg. The PAO2 is calculated with the use of the following equation (in which 0.8 is a constant):
PAO2 = FIO2 x (Patm – PH2o) – (Paco2 ÷ 0.8)
where FIO2 is the fraction of inspired oxygen (0.21 when breathing ambient air at sea level), Patm is the atmospheric pressure (760 mm Hg), PH2o is the partial pressure of water (47 mm Hg), and Paco2 is the partial pressure of carbon dioxide, as indicated by the measurement of arterial blood gas (34 mm Hg). Thus, for this patient,
PAO2 = 0.21 x (760 – 47) – 34 ÷ 0.8 = 107 mm Hg
A normal alveolar–arterial gradient, adjusted for age, can be estimated with the use of this formula:
Estimated normal alveolar-arterial gradient = 4 + (age in years ÷ 4)
For this 65-year-old patient, the normal gradient would be as follows:
Estimated alveolar-arterial gradient = 4 + 65 ÷ 4, or approximately 20 mm Hg
This patient’s actual alveolar–arterial gradient is the difference between her PaO2 as measured in the arterial blood gas analysis (52 mm Hg) and the estimated PAO2 (107 mm Hg) (i.e., 107–52 = 55 mm Hg). At 55 mm Hg, the patient’s alveolar–arterial gradient is substantially higher than the estimated gradient of 20 mm Hg.
Hypoventilation & a reduced level of oxygen tension do not influence the alveolar–arterial gradient; a VQ mismatch, diffusion impairment, or a right-to-left shunt would cause the gradient to increase. However, hypoxemia resulting from a VQ mismatch or from diffusion impairment can be corrected with supplemental oxygen (as occurred in this patient), but hypoxemia resulting purely from a right-to-left shunt cannot.
The causes of a VQ mismatch include processes that affect the airway (e.g., asthma or obstructive lung diseases), the alveoli (e.g., infection or pulmonary edema), and the pulmonary vasculature (e.g., pulmonary embolism). Although a VQ mismatch is the most likely cause of hypoxemia in this patient, an impairment in alveolar oxygen diffusion could be a contributing factor. Diffusion impairment is caused by alveolar or interstitial inflammation and is typically characterized by exercise-induced hypoxemia.
Source:
Nou D, et al. A Woman with Fever and Dyspnea. April 10, 2014. N Engl J Med 2014; 370:e25. Interactive Case
Methemoglobinemia is a condition that can produce cyanosis. It can be congenital or acquired. The condition arises when the iron in hemoglobin is converted from the ferrous Fe2+ to the ferric state Fe3+.
• Methemoglobinemia can be triggered by exposure to topical anesthetic agents, dapsone, nitroglycerin, or other strong oxidizing agents.
• In the mixture of benzocaine, tetracaine, and butamben, benzocaine can precipitate the formation of methemoglobinemia.
• Approximately 2% of hemoglobin is present in the form of methemoglobinemia.
Alveolar minute ventilation is the volume of air that enters & exits the alveoli per minute. To calculate this rate, the A
natomic Dead Space has to be taken into account & subtracted from the tidal volume. The typical anatomic Dead Space is ~ 150 mL.
Alveolar ventilation = respiratory frequency x (tidal volume - Anatomic Dead Space)
= 12 breaths/min x (500 mL/breath – 150 mL) = 4.2 L/min
The alveolar ventilation is a much better representation of functional ventilation because the alveoli are where gas exchange occurs.
Ddx tachypnea:
Heart failure
Metabolic acidosis
Pneumonia
Anxiety
Pain
Fever
Perfusion-limited Gas Exchange describes the scenario in which the rate at which gas is transported away from functioning alveoli and into tissues is principally limited by the rate of blood flow through the pulmonary capillaries and thus across the alveolar membrane.
Restrictive ventilatory defect — The many disorders that cause reduction of lung volumes (restriction) may be divided into three groups:
●Intrinsic lung diseases, which cause inflammation or scarring of the lung tissue (interstitial lung disease) or fill the airspaces with exudate or debris (acute pneumonitis)
●Extrinsic disorders, such as disorders of the chest wall or the pleura, which mechanically compress the lungs or limit their expansion
●Neuromuscular disorders, which decrease the ability of the respiratory muscles to inflate and deflate the lungs
The history, physical examination, and chest radiograph are usually helpful in distinguishing among these disorders. Spirometry can be useful in detecting restriction of lung volumes, meaning a reduced FEV1 and/or FVC with a normal or increased FEV1/FVC ratio. Evaluation of lung volumes and diffusing capacity are helpful in confirming the presence of restriction and assessing severity of impairment (algorithm 1). However, patients with mild interstitial lung disease (ILD) may have normal values for FVC and TLC [69].
In ILD, the DLCO is decreased by diffuse alveolar capillary damage, and the measured alveolar volume (VA) is low due to the loss of aerated alveoli. The DLCO corrected for alveolar volume (DLCO/VA, also known as KCO) is typically reduced to a lesser extent than the DLCO, as ILD is typically inhomogeneous with some diversion of blood flow from more diseased units to those that are less affected [31,70]. By comparison, in patients with restrictive physiology due to incomplete lung expansion (eg, neuromuscular disease or kyphoscoliosis), the DLCO is less decreased, and the reduction in DLCO is proportionately less than the reduction in VA, so the ratio DLCO/VA is actually increased. (See "Diffusing capacity for carbon monoxide", section on 'Relationship between DLCO and KCO (DLCO/VA)'.)
Changes in the FVC and DLCO are also useful for following the course of or response to therapy in patients with interstitial lung disease. Measurement of SpO2 during a six-minute walk test (6MWT) is also useful in this setting, since SpO2 often falls during mild exercise in patients with interstitial lung disease and responds to successful therapeutic interventions [71]. (See 'Six-minute walk test' above and "Approach to the adult with interstitial lung disease: Diagnostic testing".)
The force required to inflate a balloon is related to its elastance (inverse of compliance) and the change in volume. Elastance (E) is the tendency of an elastic structure to oppose deformation. The formula for the force (F) required to inflate a balloon can be expressed using the elastance and the change in volume (ΔV) as follows:
F=E×ΔV
Here:
It's important to note that this formula provides a simplified view of the mechanics involved and assumes that the elastance is constant during the inflation process. In real-world scenarios, factors like the nonlinear behavior of the balloon material and other complexities may influence the relationship between force and volume change. The elastance itself may depend on factors such as pressure and volume.
Elastance = (1/Cstatic)
Equation of Motion Video to explain fundamentals of goal of Mechanical ventilation by me
(1) Adding Extrinsic PEEP in Dynamic Hyperinflation Syndrome - YouTube
https://www.youtube.com/watch?v=4iRb9i2GZdQ
For mechanical ventilation, the normal mean airway pressure for an average adult is typically maintained between 5 to 15 cm H2O.